
Japanese net-net
Nankai Plywood Co. is another Japanese net-net. Earnings over the last 10 years have been volatile but, on average, positive. Management guides to a net profit of ¥15.50 per share for the FY 2016. According to the Japanese Company Handbook, the company is a top ranked manufacturer of Japanese-style room ceilings and floors, holding the highest market share in laminated ceilings. At its current market price of ¥412 per shares, it’s trading at a market cap of ¥3.988 billion (= US$32.034 million). With such a small market cap, institutional investors are effectively excluded from participating. It trades at a 49% discount to its NCAV of ¥7.894 billion. If one includes long-term investments in NCAV – which is sensible, I think, if one views NCAV as a proxy for liquidation value – it trades at a 59% discount. The company also owns a substantial amount of tangible fixed assets. Especially land, which I conservatively valued at 50% of book value in the liquidation analysis, could be worth more. The P/Tang.B is very low at 0.23.
Below is the translated balance sheet (using Google Translate) and a liquidation value analysis:
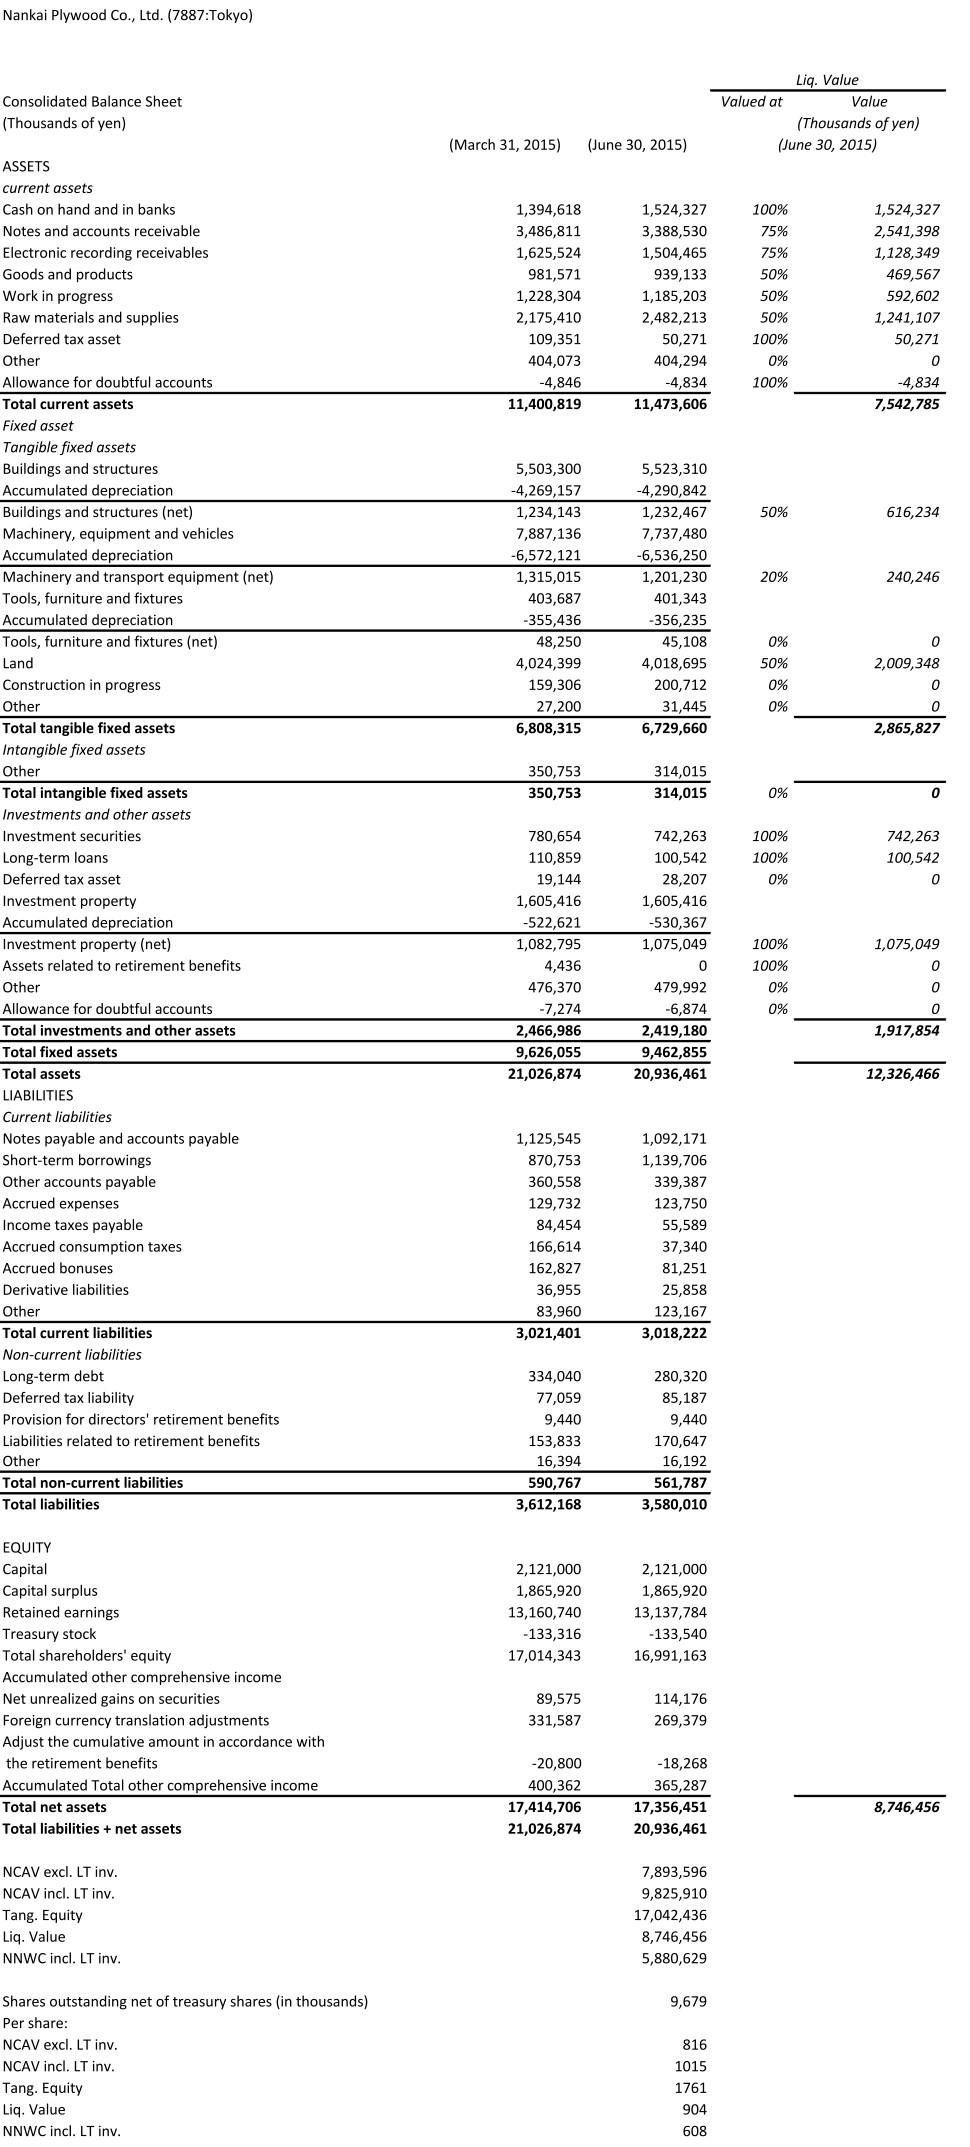
(Source: Quarterly report for the first quarter of FY 2016)
Disclosure: The author is long 7887:Tokyo.

Hi, Nankai Plywood Co Ltd (7887) increased earnings each year from 2012 to 2014 and in that 3 year period never traded above its NCAV. I know you don’t look into this anymore but that aside have your Japanese net nets performed? This is the second Japanese net net I have found with this identical pattern.
Thanks,
G
LikeLike
I haven’t been investing in Japanese net-nets long enough for my track record to have any significance. Fortunately, there are systematic tests of the net-net strategy in Japan. In “Net-Nets: Outdated or Outstanding?” James Montier finds that net-nets have beaten the market from 1985 to 2007 by a significant amount.
Japanese companies often have a very low return on equity. If their stock is valued by the market based on earnings, it might happen that they trade below NCAV for a while.
LikeLike
Thanks for the reply. I read that study – they returned 20% CAGR over the period tested. What’s interesting is that net nets are normally bought at 2/3 to NCAV i.e. 50% upside. On that basis the vast majority of these stocks would not have reached NCAV – all the counter intuitive stuff aside I would think that the non performers would be the stocks with the characteristics identified above.
LikeLike