
- Japanese net-net trading at 34% of NCAV (including LT investments, mostly securities)
- The company has recently bought back shares.
- Under the radar: Databases (e.g. Bloomberg, Thomson Reuters) have wrong numbers. They do not properly account for treasury shares and thus overstate Tiemco’s market capitalization by 35%. This leads to difficulties in finding this opportunity using stock screeners.
- Potentially less sophisticated investor base and limited arbitrage due to very small size. The actual market cap at ¥483/share is ¥1.2 billion ($11 million).
- Management expects profitable FY 2016 (ending November, 30). NCAV has been stable over the last years.
Tiemco designs, import, export, and retails fishing goods including lure and fly fishing gears. Tiemco also sells outdoor clothing such as vests, waders, jackets, and goods used for fishing. Source: Bloomberg
Like many other Japanese corporations, Tiemco owns treasury shares. Electronic databases calculate the market capitalization of Japanese corporations using the number of issued shares, not, as would be correct, the number of shares outstanding net of treasury shares. This results in massively upward biased valuation metrics for corporations that own a lot of treasury shares. Therefore, net-nets of that category are hard to find using quantitative stock screeners, which use the numbers supplied by the database. Therein lies the opportunity for mispricings.
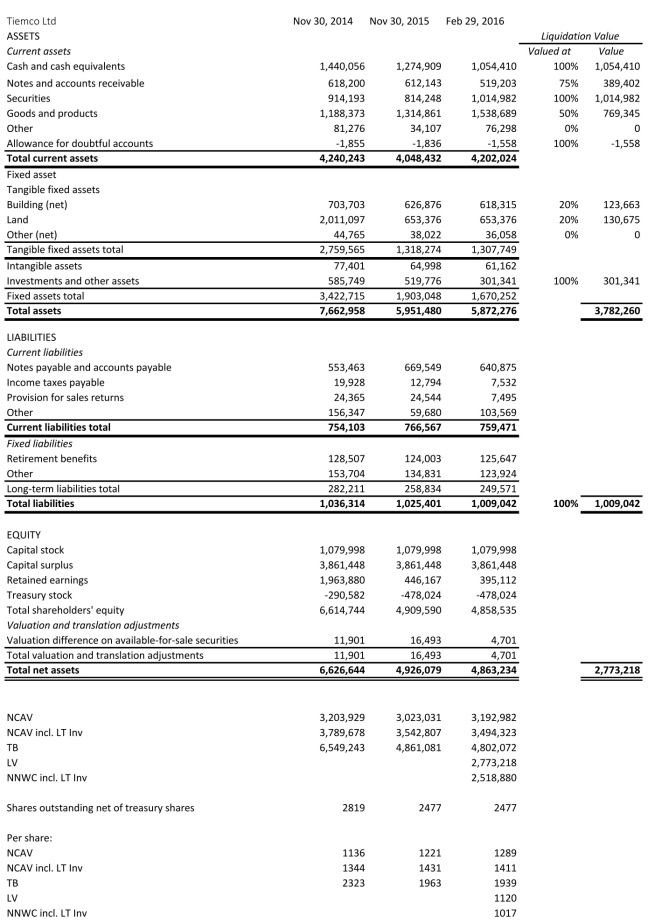
Tiemco has recently bought back shares at very cheap prices. As of February 29, 2016, the company owns 863 thousand shares. This is roughly 26% of the 3.340 million total number of issued shares. To illustrate the distortion of valuation metrics that result from using the wrong market cap, consider the discount to NCAV. Using the market cap supplied by the database, one would conclude that Tiemco is trading at a 49% discount to NCAV — interesting, but not quite the 62% actual discount. (Both calculations do not include long-term investments, which are mostly securities, in NCAV.) Assuming the NCAV approximates fair value, the apparent upside of 96% is much less than the actual upside of 163%. Below is the translated balance sheet and the calculation of net current asset value (NCAV), tangible book value (TB), liquidation value (LV), and net-net working capital (NNWC):
 Source: Company filings and http://www.kaijinet.com/
Management guides to ¥2.980 billion in sales, ¥49 million in operating income, ¥52 million in ordinary income, and ¥41 million in net income for the fiscal year ending in November 2016.
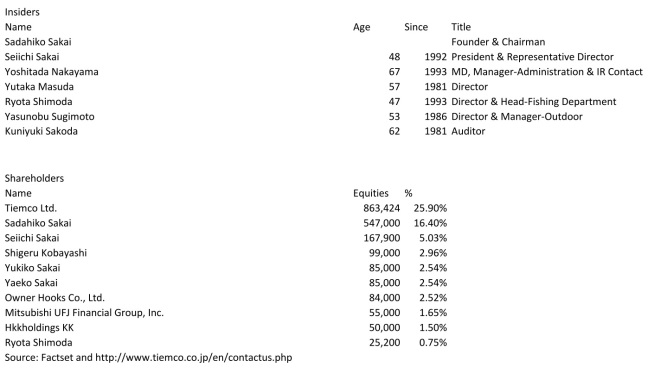
The Founder and Chairman, Sadahiko Sakai, owns a significant amount of stock. The President, Seiichi Sakai, owns a moderate amount of stock.
Disclosure: I’m long 7501:Tokyo.

Nice find, I placed an order too. Pascal
LikeLike
Loss in FY 2013, 2012.
LikeLike
Out of interest, asking as a 19 year old who has just begun to explore value opportunities, do you currency hedge your positions? Further, since this type of opportunity does not come up on screeners, what is your approach to finding them? If you have any further advice for someone looking to start a career in IM through value investing, I would love to hear!
LikeLike
Hi, Logan!
I don’t hedge currencies. Over the long run, returns shouldn’t be much different whether you hedge or not; it just increases complexity. I see different currencies as another layer of diversification.
I can find these situations because I correct the market cap. Databases do provide the correct number of shares outstanding as a separate data point. They just don’t use it in calculating the market cap. I calculate the market cap myself.
I can’t give any specific path you should follow. I will give you instead some pillars of my own strategy:
(1) Finance is full of bullshit. Focus on things that really work and add value. Work smart and relentlessly to get so good at these things that the right people will eventually notice. Also, remember, in chaos lies opportunity.
(2) Focus on niches. Avoid competition from other smart investors. Don’t try to outsmart hedge funds with more resources.
(3) Build a moat. Have a unique skill set that will eventually give you some real insight that no one else sees. This is hard, I think, by being the absolute best in one domain, even if it’s important, like accounting. You have to be very good at it. But you will probably never see something unique in accounting that the second best will not see. By having a unique combination of skills, you’ll have a better shot at getting special insight.
(4) View value investing as a way to think; not as a collection of strategies. If strategies already have a name and books have been written about it, the strategy will probably never work as well as when it was unknown. Behavioral biases inherent in value situations, however, will probably still lead to some outperformance. (And yes, I realize the irony that pretty much everything I write about is not very original. It is just extraordinarily difficult to improve on deep value strategies like net-nets. As long as I didn’t come up with something better, I will employ these strategies while working on gaining insights)
LikeLiked by 2 people
That makes sense!
With regards to your first point, I couldn’t agree more! I’m a maths student at a top British university, taking a module in corporate finance, and the main pricing method they outline is the CAPM model. It’s laughable really!
I really appreciate the advice, and will be keeping up to date with your blog!
Logan
LikeLike
Hi Jan,
You always come up with create ideas! Thanks.
To talk about this one, where can I find the annual reports? I could find them on Tiemco’s website.
All the best,
Pyxis
LikeLike
Thanks!
You can find filings at http://www.tiemco.co.jp/company/ and at http://disclosure.edinet-fsa.go.jp/.
LikeLike
I’ve owned this for years and kind of lost track of it. At this point I would have been better off buying some of their tackle and going fishing.
I see 1.4 B yen in unusual expense for last year on 2015, which is about the same as the reduction in the value of the land on the BS, so I’m guessing that is what’s behind it. Backing that out it was just another crappy year of treading water which is pretty much par for this company.
I am kind of on the fence on whether I like these types of investments or not. The longer I do this the more I like paying up for companies that actually make decent returns. Theoretically there should be some price at which the crappy ones should be good investments, but it is hard to predict which ones will turn out and which ones won’t. Another problem with these is it’s hard to know when to throw in the towel. With a company that is earning a decent ROE it’s easier to wait it out.
Overall my jap net nets have been worse than a waste of time. If I’d gotten in earlier I could have gotten the initial jump, but I was hemming and hawing over the currency implosion everyone was predicting. Later on I bought some super cheap super crappy companies and I made money on almost all of them, if you define money as yen. If you define it as purchasing power, then not so much.
LikeLike
Thanks for sharing your thoughts, Matt!
I strongly agree with you that almost anything can be a good investment at the right price. But it is hard to figure out which ones will work out and which ones won’t. I would go even one step further and say that it is virtually impossible to improve a well-designed quant net-net strategy by excluding some stocks from consideration through qualitative judgment. For that reason, I’m purely systematic in my net-net stock selection – which doesn’t mean, of course, that discount to NCAV is the only variable of my algorithm. Having a systematic approach also eliminates the problem of when to throw in the towel. I only sell if (1) the discount to NCAV shrinks due to price appreciation, or (2) the discount to NCAV shrinks due to declining NCAV, or (3) if other opportunities emerge that have a higher expected risk-adjusted return. I tested some of the, I think, arbitrary rules like selling after a 50% gain or selling after 2 years. These rules neither make economic sense to me nor could I improve the performance in my backtests.
It is a good idea to think about where the historical outperformance of deep-value strategies is actually coming from. I think it has to be a combination of behavioral biases and limited arbitrage. Limited arbitrage can be explained by the small market cap. Hedge funds and successful individuals can’t take advantage of mispricings of such small absolute size. Thus, you don’t compete with the best guys. The behavioral biases that lead investors to sell at such low prices are numerous. One of them is projecting the recent past into the future and thereby ignoring mean reversion. It is, therefore, a dangerous thing to say that over the last few years this strategy hasn’t worked and then discarding it. This bias is exactly why deep-value works and an investor trying to profit from such a bias cannot have it himself. It has been my experience that net-nets often don’t move at all for many months to a few years and then jump 100% or more in a few days. I don’t think there is such a thing as an a priori identifiable “perennial net-net” or a “value trap”.
LikeLike
Good idea and write-up. Thanks!
LikeLike
Hi, thanks for sharing the interesting ideas. How do you handle the japanese reports? Is there a way to translate those PDFs ? Google Translate does not work in my case. Best regards
LikeLike
Hi!
I suspect you can’t translate the reports because you’ve got protected PDFs. Get the reports from http://disclosure.edinet-fsa.go.jp/EKW0EZ1001.html?lgKbn=1&dflg=0&iflg=0. Those should be translatable without a problem.
LikeLike
Do not click on the PDF icon but on the report itself. It should open in another window.
LikeLike
Thank you for your fantastic analysis and the insightful response to the questions above.
With reference to the following comment:
“I don’t think there is such a thing as an a priori identifiable “perennial net-net” or a “value trap”.”
I dug into 7501 more and found it made a net loss from 2011 through to Q1 2016 – this explains in my mind why during this period it has not traded above its NCAV (according to my calculations).
In 2010 and Q2 2016 when it made a net profit; the net profit margin was 0.5% and 1.1% respectively. I don’t know the fishing retailing industry but that doesn’t seem adequate.
In my mind a business is only worth its profits (and dividends); 7501 does not appear to have had the ability to generate profits in the past – is there a catalyst or something else that makes you believe this stock can trade above its NCAV?
Kind regards,
G
LikeLike
Thanks for your questions and kind words!
I trade net-nets purely on a quantitative basis. That means I don’t usually look for catalysts or any qualitative reasons for the probable undervaluation, e.g., industry conditions, management, regulation risk, etc. I did this for a few years, but not anymore. I believe it will introduce a systematic error that will reduce my performance. I regard net-nets as a game of probabilities with a positive expected outcome. Sure, I will from time to time put money into a preventable loss. But this is a known error rate. I’m not willing to trade this for the unknown – and I believe higher – error rate introduced by behavioral biases.
I agree that the low (or negative) profitability is probably a reason for the cheapness of this stock. But like I wrote here: https://deepvalueideas.com/2016/07/28/ugly-vs-pretty-value-stocks/, loss-making net-nets actually performed better historically. There are a few reasons for this. Whenever I see a profitable net-net, I immediately get suspicious. In normal times, profitable (or, I should say, apparently profitable) businesses don’t usually trade under NCAV. There is likely something wrong with such a stock that is much more serious than recent losses, e.g., fraud, etc.
On another note, I don’t necessarily hold on to my positions until they reach their intrinsic value. Rather, I rebalance my portfolio on specific dates. This will ensure that I hold the most undervalued stocks at all times.
LikeLike
Thanks for the fast and detailed response – awesome stuff!
I would like to dive deeper into some of your comments if that’s okay – apologies if these questions have been answered elsewhere as I am new to your site.
I think being quant is a great idea. Would you please share what parameters you set? There are some parameters backed by empirical evidence (size, debt levels, discount to NCAV) so I was hoping to get your take on it.
Agree; loss making net nets per Carlisle’s extension of Oppenheimer’s original research shows this. However, it also shows that the quintile of net nets with the largest discount to NCAV produced the lowest returns – my interference is the discount to NCAV needs to be married with some ‘quality’ attributes.
As for fraud I believe net nets default at about twice the rate of the rest of the market. What about using the M-score to test for the manipulation of financial results and a Z-score for bankruptcy risk?
Furthermore, the distinction between what is quantitative and qualitative is somewhat blurred in my mind. Having criteria such e.g. as x% net profit margin with last x years is a quantitative measure; I guess the larger part of such a metric is has it been empirically tested and shown to impact returns?
What criteria did you use to use before going fully quantitative?
What caused you to change; behavioural basis alone? To me introducing a basis occurs when variables not shown to improve returns are included – other than that the inclusion of any measurable variable shown to improve returns is a benefit to one’s evaluation criteria and therefore likely returns.
If you don’t mind sharing what was your previous CAGR using your previous method and you new method?
Thanks for sharing your holding/rebalancing strategy – to me this is important as it interacts with the buying criteria.
Kind regards,
G
LikeLike
Excellent questions!
I won’t disclose my full algo here, but I can tell you that it is very hard to improve on just ranking by discount to NCAV. I do take some quality measures into account. For example, I screen out all Chinese stocks. This does improve the backtested results considerably. Other quality measures, like debt levels, as you mentioned, do surprisingly little. Net-nets typically have little debt, though. I tested quite a few other quality measures and a lot of them indeed impair the performance.
I don’t know for sure, but the underperformance of the cheapest quintile might be due to data issues. Carlisle, I believe, used Compustat data, which is the highest quality fundamental data I’m aware of. But even this database is not perfect. If, for example, the company liquidated major assets and already returned the capital via special dividends to the shareholders, but the current financial statements do not reflect this return of capital yet, stocks can look extremely cheap on the surface. Quite often my screen picks up a stock trading at 5% of NCAV or something. That tells me immediately that there is probably a data issue. I have to then investigate a little further. Hence, if you want to trade 100% automated, which I can’t recommend because the data just isn’t good enough for these micro caps, then it might be a good idea to screen out everything below 20% of NCAV, for example. This will probably screen out most of the junk. Another cause might be just chance. There aren’t that many net-nets available. Thus, a quintile of that amount is a very small sample size. Excluding the cheapest quintile just based on this study might be overfitting.
Yes, it appears to me that the terms “quantitative” and “qualitative” are not used clearly by investors (myself included). What I mean by “quantitative” data is that I can build an algo with that data, which then can be tested. But you can quantify qualitative variables. For example, whether or not the company has a “good” management is a qualitative factor. Traditional value investors would do a judgment based analysis to figure out whether the management is good or bad. A quant could look at historical fundamental or other data and build an algorithm that classifies the management as good or bad.
Before I went fully quant I did a lot of Sum-of-the-parts valuation, special situations, classic fundamental analysis, etc. I had the opportunity to test some algorithms with Compustat data and the results were much better than expected. I tested a lot of “value investing rules” and found that a lot of them are just not predictive of future returns at all. This led me to question the almost religious following of certain investors and books that were written before we had this massive amount of data to actually do empirical work with. Don’t get me wrong, a lot of the classical value investing literature is incredibly valuable. It is extraordinary how much Ben Graham had figured out without the benefit of today’s technology. And a lot of his insights seem true. At least they are very good hypotheses, based on economic sense. Where I differ from other value investors is that I view these as what they are, hypotheses, which are to be tested by scientific standards. If the evidence suggests that a hypothesis is false, I will not use the tested measure in my investing — regardless of its author.
No, there is massive psychological evidence that even if humans have access to more data, simple algorithms outperform them in a variety of fields. (See: Grove, W., Zald, D., Lebow, B., and B. Nelson, 2000,
“Clinical Versus Mechanical Prediction: A Meta-Analysis,”
Psychological Assessment 12, p. 19-30.)
For an excellent primer on this subject, I’d recommend the article “Are you trying too hard?” by Wes Gray.
CAGRs:
177 Days from July 08, 2011 to December 31, 2011: 8.30%
Full Year 2012: 36.64%
Full Year 2013: 52.08%
Full Year 2014: -2.94%
Full Year 2015: 12.12%
Half Year 2016: approx. 18.00%
I’d say somewhere in 2015, I went 80% quant.
LikeLike
I won’t tell anyone what you algo is! 😉
Actually, even if you reveal it I think it would be hard for many to stomach. Thanks for reinforcing that the discount to NCAV is important. I would think in addition to Chinese firms you would kick out exploration companies, financial firms and those subject to heavy regulation. Debt levels according to Tweedy, Browne does improve performance so I take heed.
I’ll re-initiate the discussion in relation to the Carlisle study under your awesome article (https://deepvalueideas.com/2016/07/28/ugly-vs-pretty-value-stocks/) as it is most relevant there.
I agree; in general good management would be one that buys back shares when trading below NCAV – this is something quantifiable.
Would you care to share which value investing rules did not predict future results and be a myth buster?
” If the evidence suggests that a hypothesis is false, I will not use the tested measure in my investing — regardless of its author.”
Love it ; agree with it – awesome! How would a retail investor be able to test a hypothesis?
Great recommendations; thank you for being so specific with your references – very professional. I read Wes’s DIY Financial Advisor where is talks about models being a ceiling not a floor to performance. I think this was discussed in Thinking, Fast and Slow and Deep Value too. My issue is working out which variables add to performance and which create noise, or, more bluntly, error. I am doing my utmost to learn.
Is Wes’s article ” Are you trying too hard” a derivative of the speech given by Dean Williams in 1981? I really like Alpha Architect’s blog posts.
Your returns are fantastic, congratulations on turning your intellect into something financially productive!
Kind regards,
G
LikeLike
No, excluding certain industries from consideration has unequivocally reduced the performance of my algorithm. Biotech, mining, technology, airlines, even shells with no business at all; as long as they are sufficiently cheap they can be good investments (depending, of course, on your holding period). „Never invest in airlines“, by the way, is a good example of a rule that is not very helpful. (That said, I wouldn’t want to hold an airline stock for 10+ years.)
Since we are talking about net-nets, other examples of rules that didn’t improve (or in fact reduced) the performance of my net-net backtests are the selection and selling criteria for net-nets by Ben Graham himself. We talked about profitability. Also, strict debt-to-assets rules reduced the performance. As did the rule to sell after a 50% gain. What really counts is the discount to NCAV.
Getting your hands on high-quality data is difficult as an individual. You obviously need a database that accounts for all the biases and pitfalls of backtesting (e.g. survivorship bias, look ahead bias, splits, dividends, etc.). Everything you test with data that is not point-in-time data is more than useless. The best data is CRSP/Compustat. This data is expensive! You may want to enroll in a Masters or Ph.D. program at a university that is a WRDS member. (This would likely be cheaper than buying the data outright as an individual.)
If somebody reads this who knows of a way to get CRSP/Compustat data as an individual (maybe through some club membership, etc.), please contact me!
There is a service called Portfolio123. There you have limited access to Compustat data (starting 1999). Just backtesting; no research.
I’m currently playing around with Quantopian. This is a great idea and you can do very cool research in their research environment. This also serves as an incentive to learn Python. I’m still not 100% confident in the data quality as they use morningstar fundamental data (starting 2002).
LikeLike
How far have you progressed with Quantopian? Have you found any sample that is based on P/NCAV, P/TB or similar to start with?
I’m screening based on P/NNWC combined with a few other parameters & would like to backtest if what I’m doing seems like a good idea. I am also a programmer (though with limited experience in Python).
I have just briefly looked at Quantopian, but it wasn’t as straightforward as I had hoped for – and I don’t want to spend too much time doing “meta-work”. Though in principle, it’s probably a very good idea to test my screening system, since it is rather complex and involves a great deal of self-invention.
LikeLike
I understand where you are coming from. Getting familiar with Quantopian is a project in itself. I’m not yet at the point where I can build an interesting algo that I would entrust with my money. I don’t plan on testing any micro-cap net-net strategies with it. I use it to work on strategies to employ once I’ve outgrown net-net strategies due to their capital restrictions. So this is a multi-year project. I actually like the “meta-work” aspect of it. I like to do something on the side that is outside my comfort zone. It is a great way to get familiar with quantitative finance and programming (I don’t have any programming background at all). I’m going to start my Masters in Quantitative Finance the coming semester and I think it can be a great resource to do some practical work supplementing the course work.
You may want to look into Portfolio123. It is $300/month and might suffice your needs. You can definitely build an NNWC strategy with very little effort.
LikeLike
Thank you for your answer. Masters in Quantitative Finance sounds very useful and fun, good luck with that!
I really have no excuse for not learning Quantopian, so I have begun with the tutorials. I also found the algorithm “Case Study: Traditional Value Factor 1” which seems like a good sample to start from.
I have been working with screener.co for quite a while, so my strategy is more complex than NNWC and really relies on my own beliefs, so I would be foolish to not try to backtest it (as opposed to finding out on the market as I do now). I think there could be a lot to gain from more advanced screening and the SQL approach of screener.co is great for that, even better would be a screener framework that could be used with/from a programming language.
I’m hoping this will be fun 🙂
LikeLike
Thanks!
That’s awesome! Great attitude!
LikeLike
Thank you so much for your insightful responses. I have sent you articles to friends and they too have been really impressed with your blog too!
To delve into this a bit more what I have learned with regard to firm types and net nets is to avoid Chinese companies, resource exploration companies, pharmaceutical development companies, real estate companies, ADRs, financial companies, regulated industries, and closed end funds. The unifying reason behind excluding all of these firms is that you have to be able to assume that the numbers you base your analysis on are real and not subject to large sudden changes.
Now I think it makes perfect sense to exclude resource exploration firms – as I understand it they start with a pile of cash and burn through it and a few turn out to find what they’re looking for. In essence the NCAV on which one basis their net net thesis is being eroded each day.
Chinese firms – I get it.
Financial companies – their balance sheets are structured quite differently so I can see why one would give them a miss, or rather they seem unlikely to be net nets anyway.
Pharmaceutical development companies/biotech – same as resource exploration companies in my mind.
Regulated companies may need government approval for turnaround plans, buyouts, etc, and all of this may make a company much less appealing to firms who would otherwise be interested in purchasing it.
Real Estate, ADR’s and funds I don’t know much about.
Do you include all of the above firm types (other than Chinese companies)?
Kind regards,
G
LikeLike
Many thanks for recommending my blog to your friends!
The short answer to your question is yes. I do not exclude any of the industries you mentioned.
One of the investors I admire the most is Joel Greenblatt. He has one of the best track records of any value investor and clearly a lot of skill. As you know, he also developed a quantitative strategy. He once shared the story how he wanted to improve the results of his strategy by excluding “sure losers”. He excluded a pharmaceutical company whose main drug was going off patent. Well, that stock turned out to be the biggest winner for the period. In the last year, I witnessed two pharma companies, trading significantly below net cash, whose only drug turned out to be useless, returning over 1000%. These are just anecdotes, not real data. So I don’t put too much weight on it. And, of course, there are plenty of such companies going to zero. But my tests unequivocally reveal that excluding certain industries reduces the performance. Your reasons for doing so seem very sensible. I had the exact same hunch. This is why I tested it. But it turned out that the exclusion of any industry I tested is a bad idea on average.
LikeLike
Wow, that is quite profound.
As a result of your insight I decided to do some digging and found the source of my current understanding as it was something I was just told (i.e. to exclude certain industries ) rather than something I had seen empirical research myself.
In the study “Net Current Asset Value, Financial Distress Risk, and Overreaction” they do the following with their data:
“We analyze the performance of all NYSE, AMEX, and NASDAQ firms based on monthly return (with dividends) data associated with firms listed on the University of Chicago Center for Research in Security Prices (CRSP) data base from 1971-2007. Only data associated with ordinary common shares are used. Thus, American Depository Receipts, closed-end funds, and real-estate investment trusts are excluded from the analysis. Firms with SIC code numbers reflecting industries regulated at any time during this interval involving utility, airline, credit intermediation, and insurance companies are also excluded.”
The result of a 12 month holding period for firms trading at 2/3 of NCAV value from 1971-2007 was an average return of 32.8% – this seems in line with the results of most net net studies with respect to such a discount to NCAV and a 12 month holding period.
So my conclusion is excluding certain industries etc doesn’t appear to have an adverse impact on returns.
What are your thoughts given your tests showed different results?
Thanks for the great discussion.
Kind regards,
G
LikeLike
Thanks for bringing this evidence to my attention. I wasn’t aware of this particular study. I’m always trying to force myself to look at disconfirming evidence. For, despite the pain of always questioning one’s most valued beliefs, this is the only way to get to the “truth” consistently.
The results you cite, however, are perfectly in line with my results when excluding these industries. The important question here is what are the results if those industries are not excluded. Oxman, Mohanty, and Carlisle (2012) test the net-net approach without excluding industries over a similar time period. Their results are significantly higher than the results you cite and, likewise, perfectly in line with my results. I should add, however, that one should be careful comparing the results of these studies as the net-net approach is so very dependent on the lower limit of company sizes one allows. Returns are strictly and rapidly deteriorating as the lower market cap limit increases.
LikeLike
No worries, glad I could actually help you for a change!
“The results you cite, however, are perfectly in line with my results when excluding these industries.”
I didn’t occur to me that result of better than 32.8% were attainable!
“The important question here is what are the results if those industries are not excluded. Oxman, Mohanty, and Carlisle (2012) test the net-net approach without excluding industries over a similar time period. Their results are significantly higher than the results you cite”
Their study (Ben Graham’s Net Nets 75 Years and Still Outperforming) showed a monthly return of 2.55% i.e. 35.28% annually – do you concur with this? Or is their another study. The one I read was from 2010.
“and, likewise, perfectly in line with my results.”
Great to hear your tests reconcile with the academics and institutions!
Thanks,
G
LikeLike
Hi, revisiting the aforementioned studies I found that in “Net Current Asset Value, Financial Distress Risk, and Overreaction” the result of a 12 month holding period for firms trading at < 2/3 of NCAV value from 1984-2007 (Table 3, Panel C) was an average return of 33.7%.
"Ben Graham’s Net Nets 75 Years and Still Outperforming" showed a monthly return of 2.55% i.e. 35.28% annually (compounded) for the virtually identical period (1984-2008).
What are your thoughts on this? I don't quite know what to make of it other than, perhaps, industries are not of material consequence to net net investing, or in "Ben Graham’s Net Nets 75 Years and Still Outperforming (2010)" they made the same exclusions but did not specify it in their "Data and Methodology" (given the similarity in results).
Kind regards,
G
LikeLike
Hi,
I was wondering, do you adjust your NCAV value for off-balance sheet items such as operating leases ? If so, how to you find them for Japanese firms?
Thank you,
G
LikeLike
Only if it is a significant amount. I translate annual reports with Google Translate (into English) and search them for related terms. Then, I just try to make sense of the word soup. This is generally not that hard for Japanese reports. For something like Korean it is much harder, but also doable if you know the accounting standards.
LikeLike
There is an easier way for japanese stocks on http://www.kaijinet.com/jpExpress. Saved me a lot of time.
Btw. very good blog.
LikeLike