
Corporate filings provide a wealth of information and are available for all major publicly traded corporations. Apart from financial statements, most of the information is in textual form. To make them usable in algorithmic trading strategies one has to preprocess them with tools from natural language processing. In the following, I’ll demonstrate a method to construct clusters of stocks based on similarity of documents. In addition, topic modeling by singular value decomposition (SVD) and latent Dirichlet allocation (LDA) of Blei et al. (2003) is used to estimate exposures to risk factors.
Hierarchical Clustering by 10-K Item 1
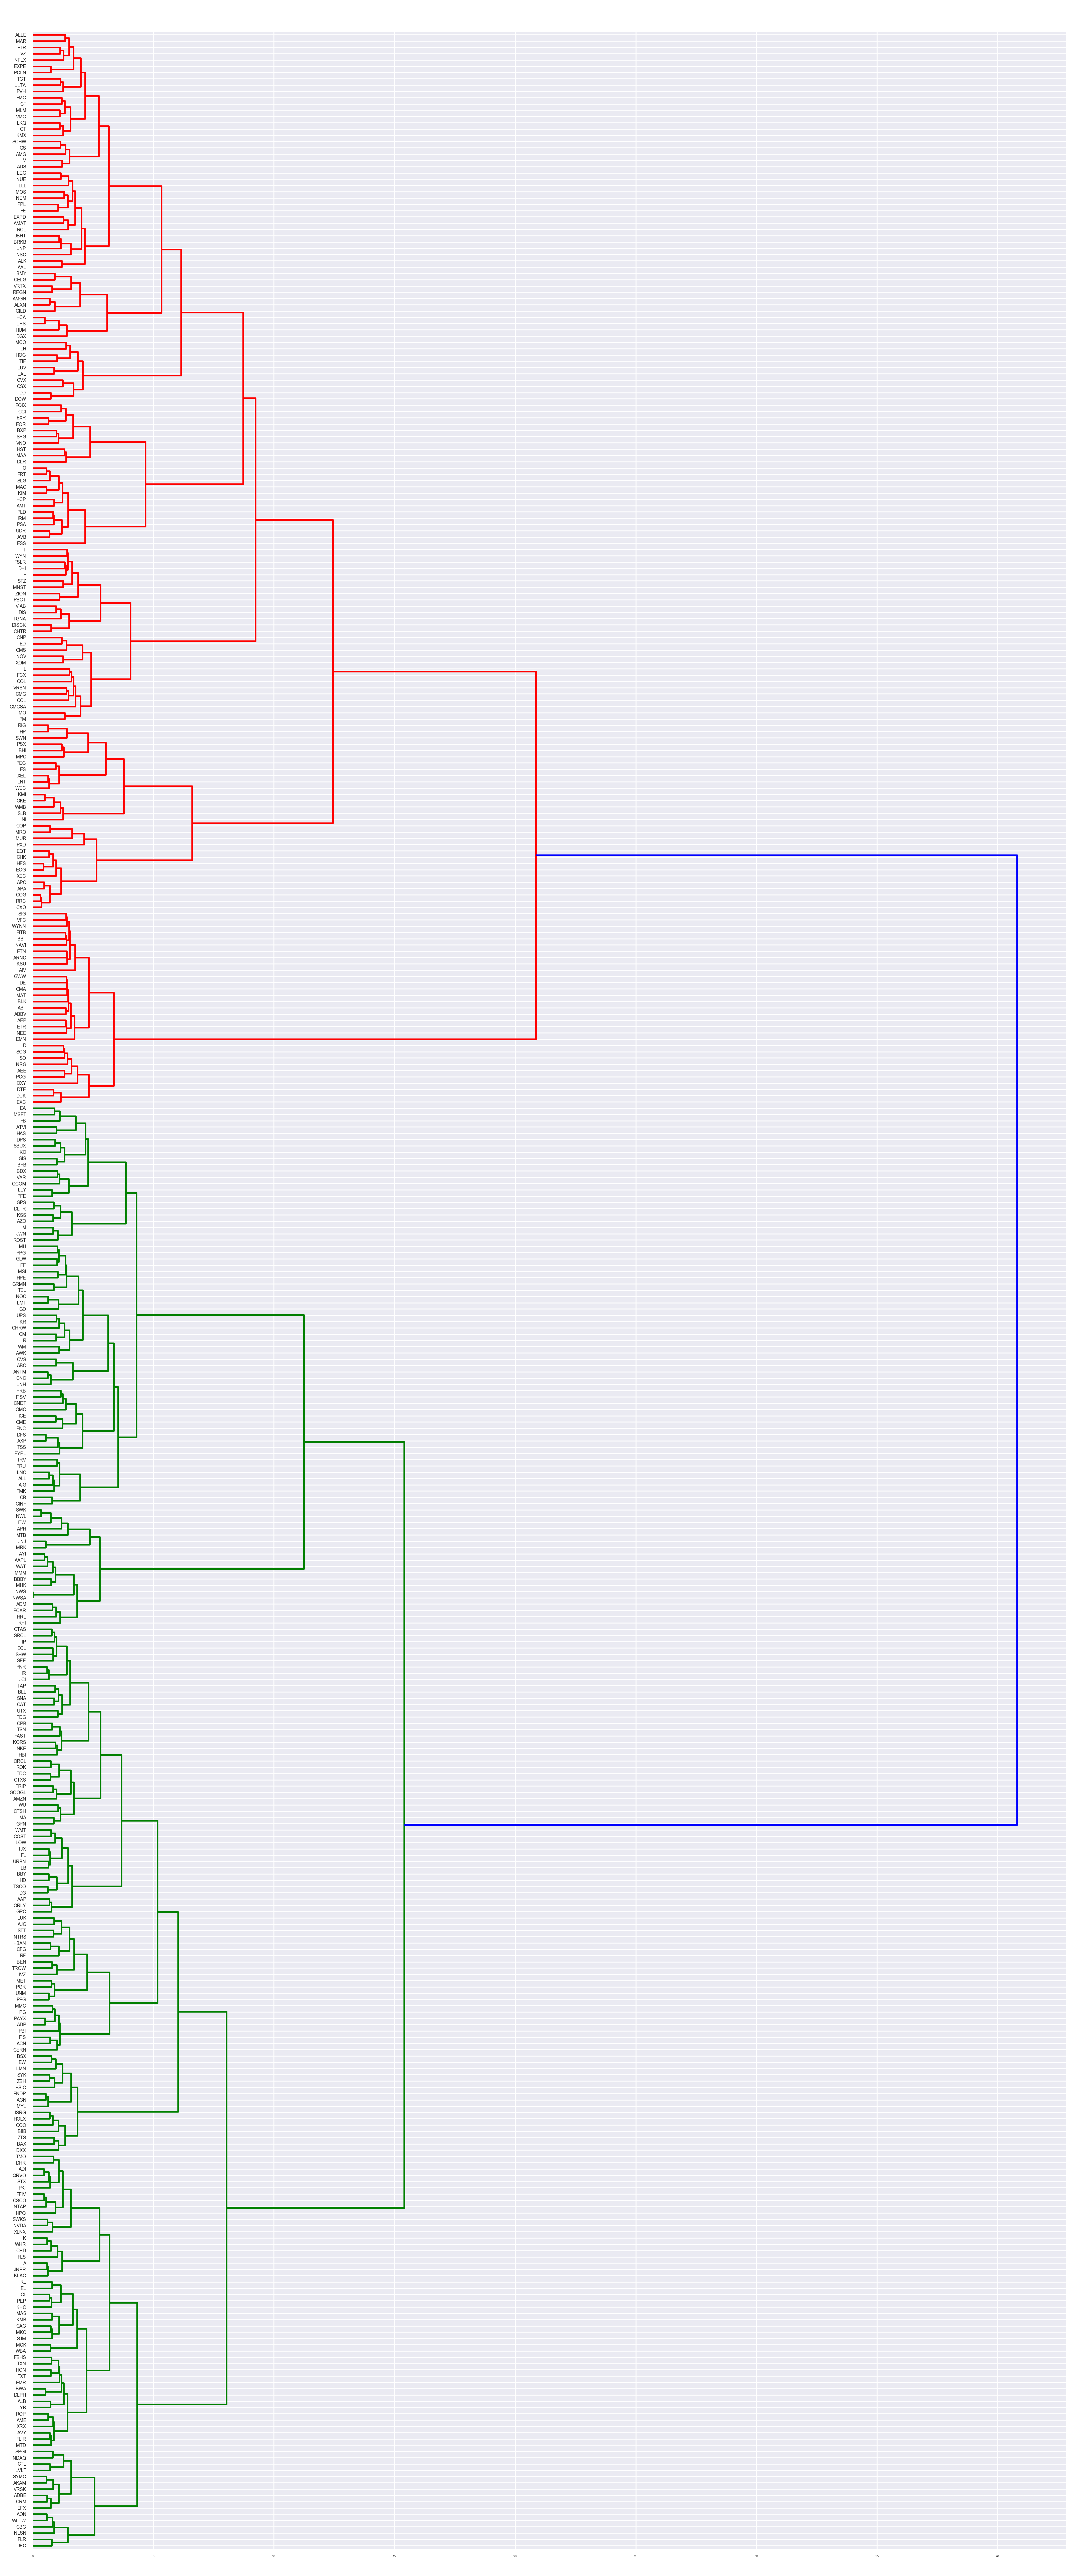
10-K filings of the 500 largest US stocks are downloaded. Certain sections such as Item 1 and Item 1A are extracted based on regex rules. 387 documents for each section remain after filtering. Next, a machine readable term-document matrix is constructed via a tfidf-vectorizer. To cluster stocks according to the business description the cosine similarity matrix of the vectorized Item 1 is fed into a ward clustering algorithm and the resulting linkage matrix is visualized via a dendrogram in Figure 1.

Three main clusters with many sub clusters emerge. The cluster colored in red, for instance, groups banks together.
Topic Modeling of 10-K Item 1
By singular value decomposition (SVD) of the tfidf-vectorized matrix, we can extract the most important topics. Figure 2 displays the 20 most important topics with its respective 10 most common terms. While not perfect — keep in mind we’re only using 387 documents — some clear patterns emerge. For example, the second topic relates to financial institutions, the third topic relates to energy companies, and the fourth topic relates to pharmaceuticals.
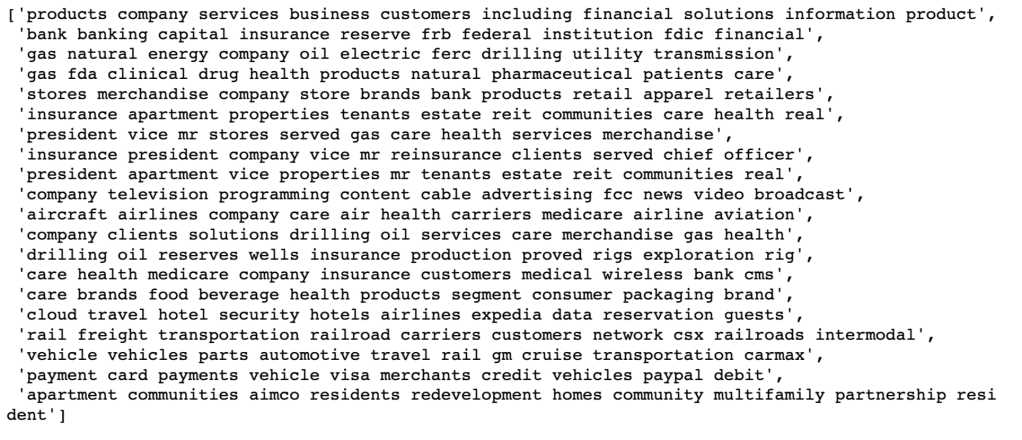
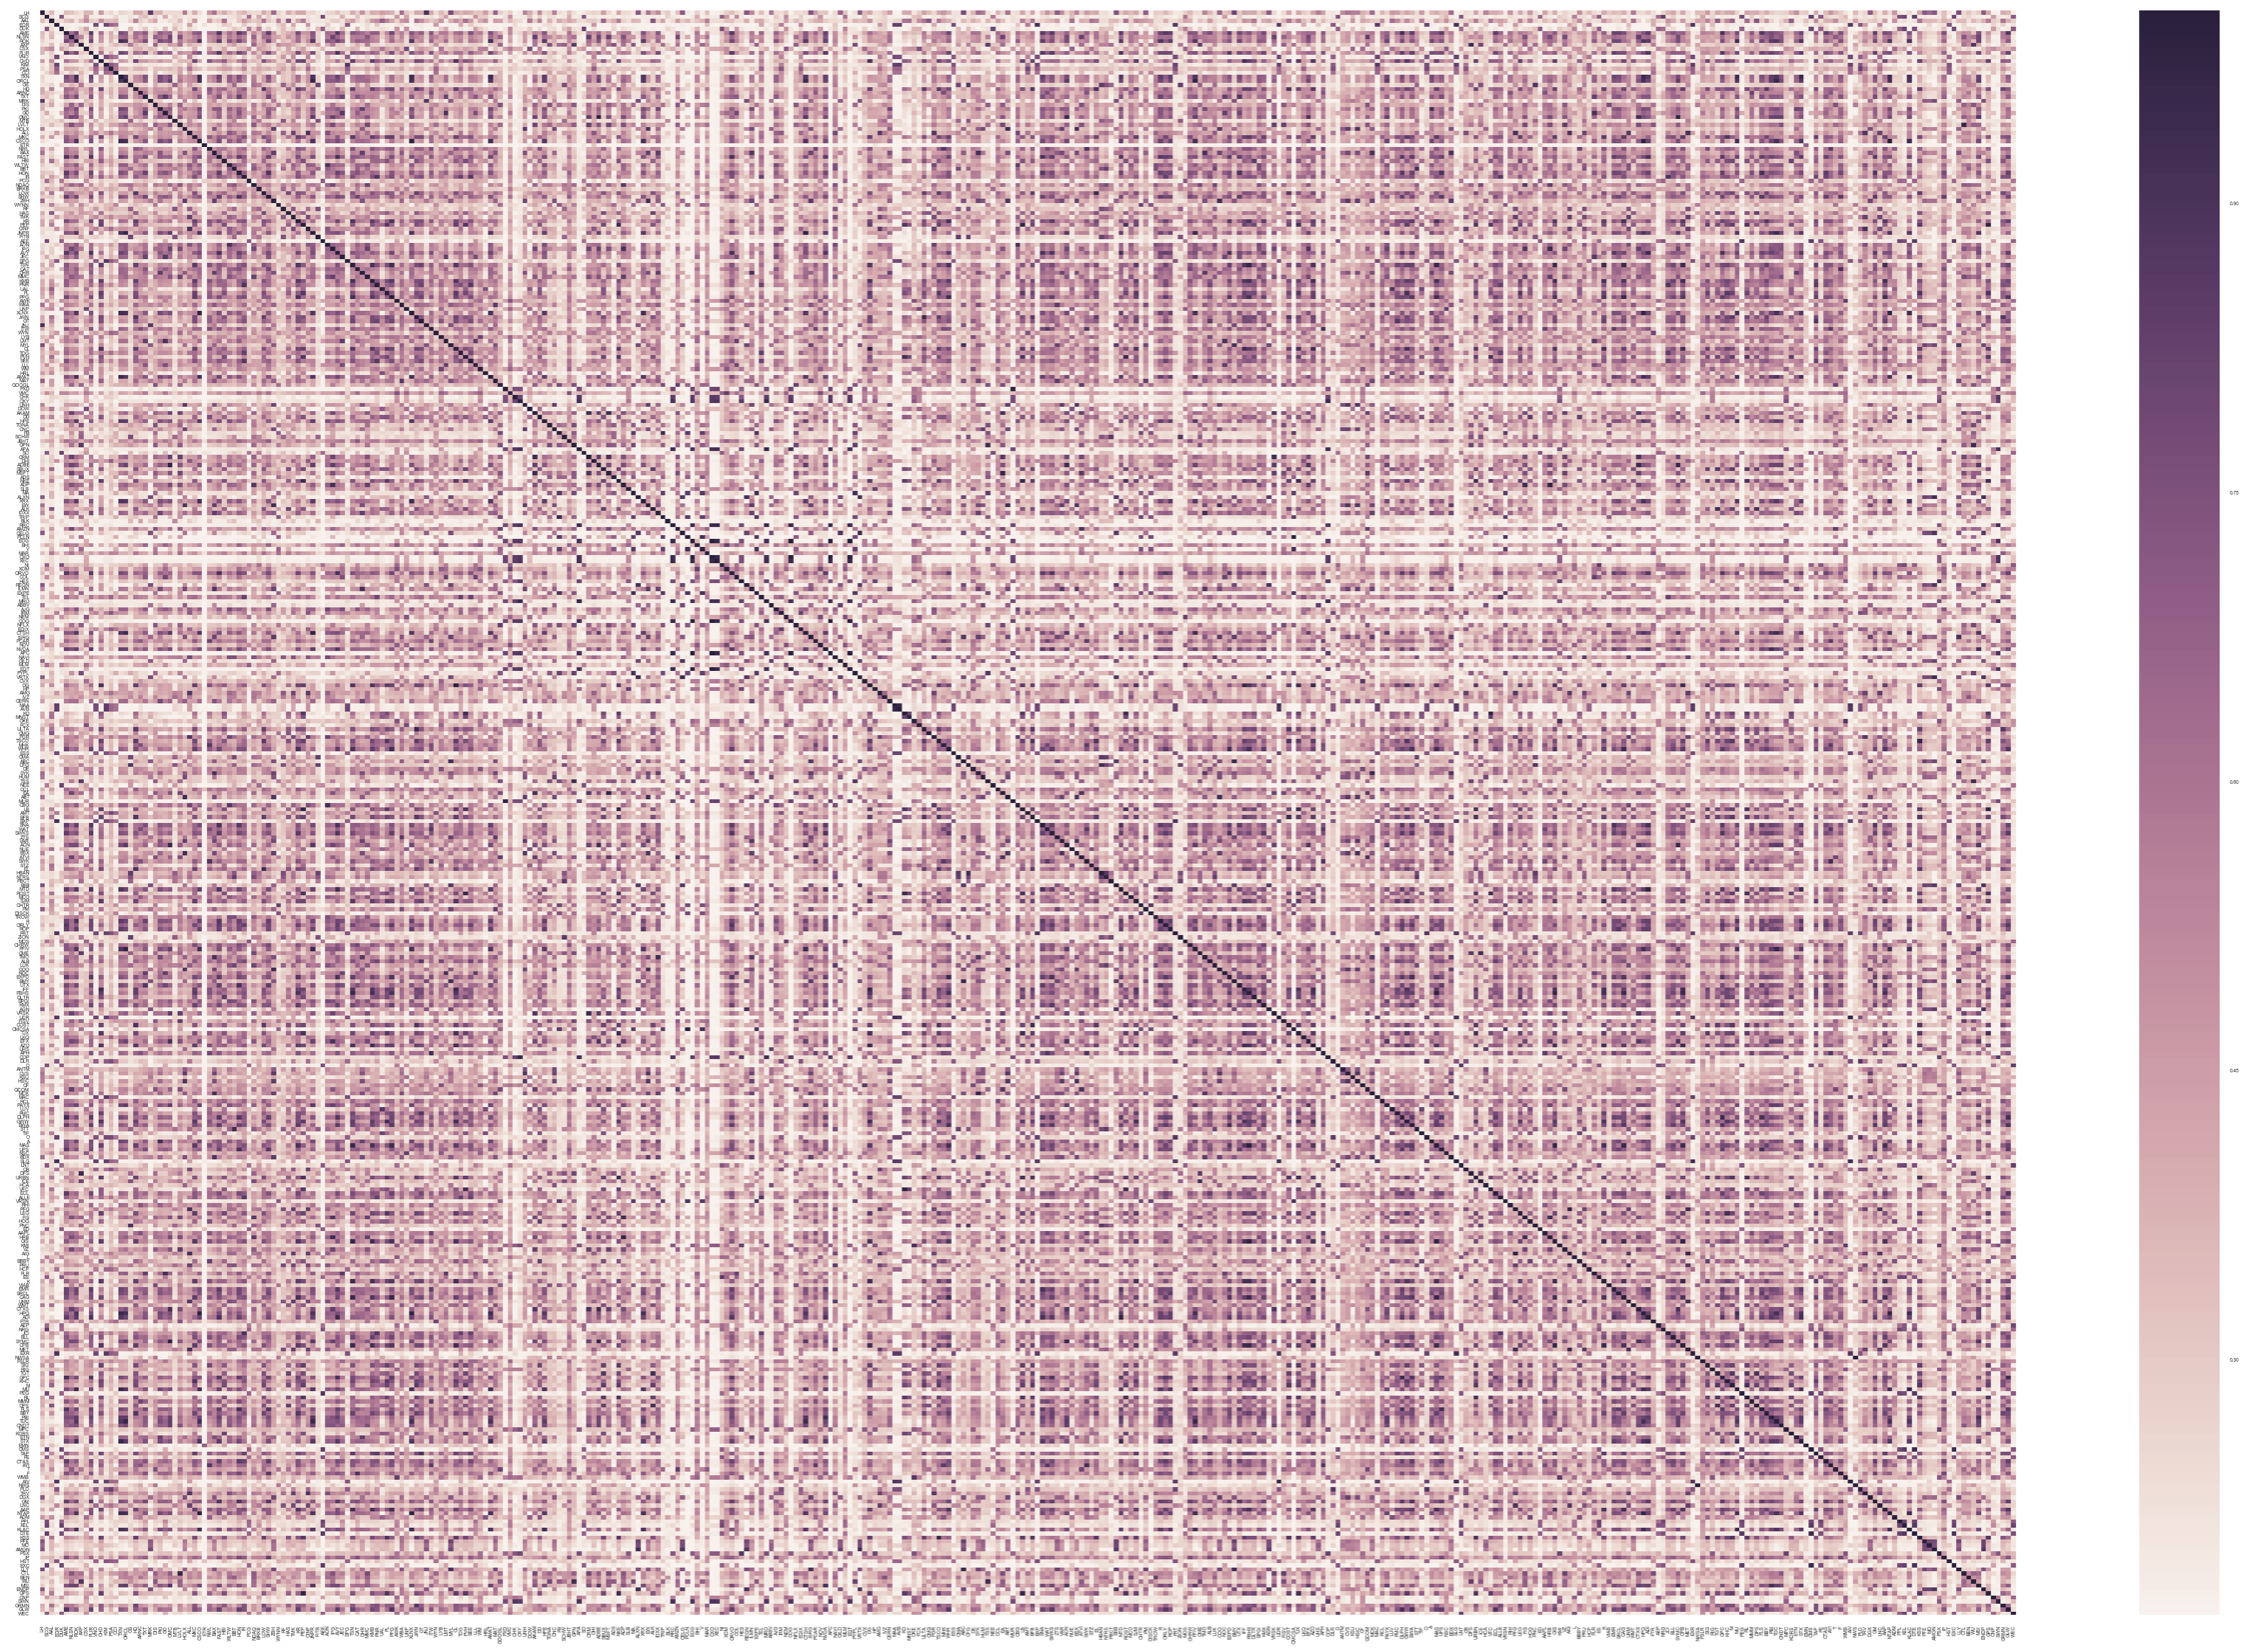
Figure 3 displays the entropy heatmap from LDA topic distributions of all stocks.
Hierarchical Clustering by 10-K Item 1A
Instead of clustering stocks according to business description, it’s also interesting to group them according to risk factors. Doing the same procedure as described before for Item 1A, we obtain the dendrogram displayed in Figure 4.
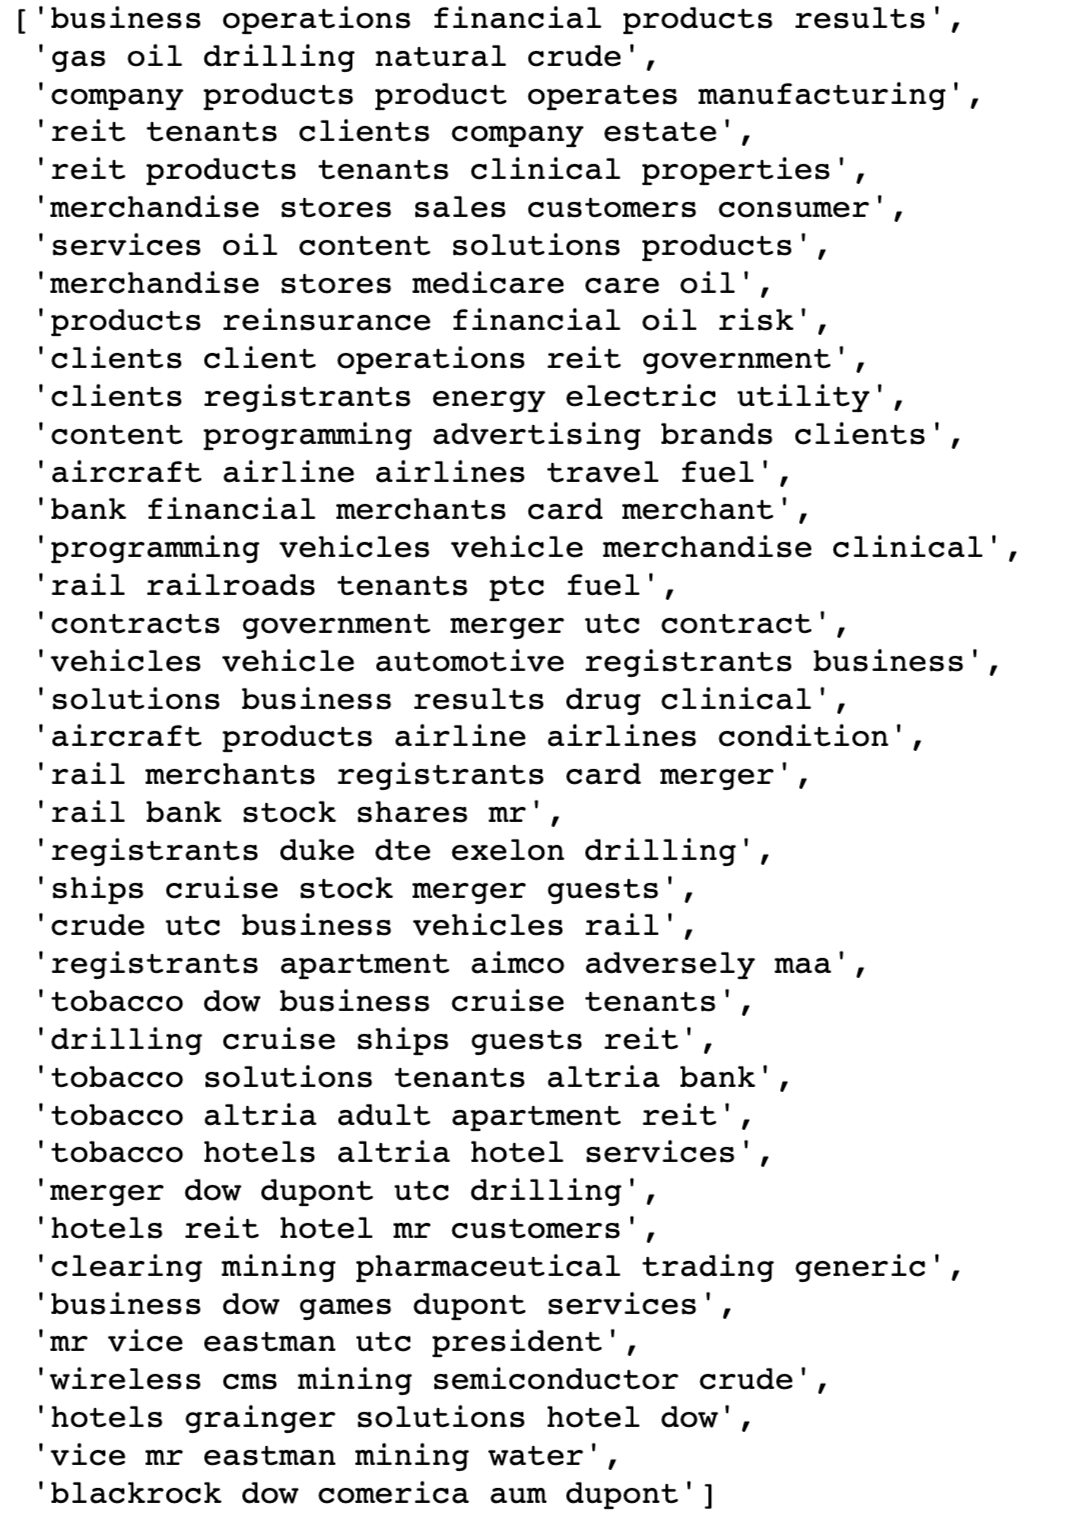
Topic Modeling of 10-K Item 1A
Observing the topics extracted via SVD in Figure 5, one can identify several topics relating to, e.g., oil, real estate, automotive, and airline risks. Again, the topics are not perfectly clean and hyperparameter tuning and more data will probably improve results considerably.
Conclusion
Use cases for these methods are, for example, statistical arbitrage strategies and portfolio optimization. One can construct very granular clusters of stocks belonging to similar businesses. The similarity matrix can also be input to a function that creates a positive-definite matrix which can then be used as a shrinkage target in covariance matrix estimation.
References
Blei, David M., Andrew Y. Ng, and Michael I. Jordan. “Latent dirichlet allocation.” Journal of machine Learning research 3.Jan (2003): 993-1022.
Code available at https://github.com/jpwoeltjen/nlp_finance
