Tiemco Ltd (7501:Tokyo)

  • Japanese net-net trading at 34% of NCAV (including LT investments, mostly securities)
  • The company has recently bought back shares.
  • Under the radar: Databases (e.g. Bloomberg, Thomson Reuters) have wrong numbers. They do not properly account for treasury shares and thus overstate Tiemco’s market capitalization by 35%. This leads to difficulties in finding this opportunity using stock screeners.
  • Potentially less sophisticated investor base and limited arbitrage due to very small size. The actual market cap at ¥483/share is ¥1.2 billion ($11 million).
  • Management expects profitable FY 2016 (ending November, 30). NCAV has been stable over the last years.


Tiemco designs, import, export, and retails fishing goods including lure and fly fishing gears. Tiemco also sells outdoor clothing such as vests, waders, jackets, and goods used for fishing. Source: Bloomberg

Like many other Japanese corporations, Tiemco owns treasury shares. Electronic databases calculate the market capitalization of Japanese corporations using the number of issued shares, not, as would be correct, the number of shares outstanding net of treasury shares. This results in massively upward biased valuation metrics for corporations that own a lot of treasury shares. Therefore, net-nets of that category are hard to find using quantitative stock screeners, which use the numbers supplied by the database. Therein lies the opportunity for mispricings.

Tiemco has recently bought back shares at very cheap prices. As of February 29, 2016, the company owns 863 thousand shares. This is roughly 26% of the 3.340 million total number of issued shares. To illustrate the distortion of valuation metrics that result from using the wrong market cap, consider the discount to NCAV. Using the market cap supplied by the database, one would conclude that Tiemco is trading at a 49% discount to NCAV — interesting, but not quite the 62% actual discount. (Both calculations do not include long-term investments, which are mostly securities, in NCAV.)  Assuming the NCAV approximates fair value, the apparent upside of 96% is much less than the actual upside of 163%. Below is the translated balance sheet and the calculation of net current asset value (NCAV), tangible book value (TB), liquidation value (LV), and net-net working capital (NNWC):


2016_02 BS TiemcoSource: Company filings and http://www.kaijinet.com/

Management guides to ¥2.980 billion in sales, ¥49 million in operating income, ¥52 million in ordinary income, and ¥41 million in net income for the fiscal year ending in November 2016.

The Founder and Chairman, Sadahiko Sakai, owns a significant amount of stock. The President, Seiichi Sakai, owns a moderate amount of stock.

2016_02 insiders Tiemco


Disclosure: I’m long 7501:Tokyo.

QC Holdings, Inc. (QCCO:NASDAQ / OTC)

  • Delisting of already hated stock resulted in forced/indiscriminate selling
  • Stock down over 44% in one day
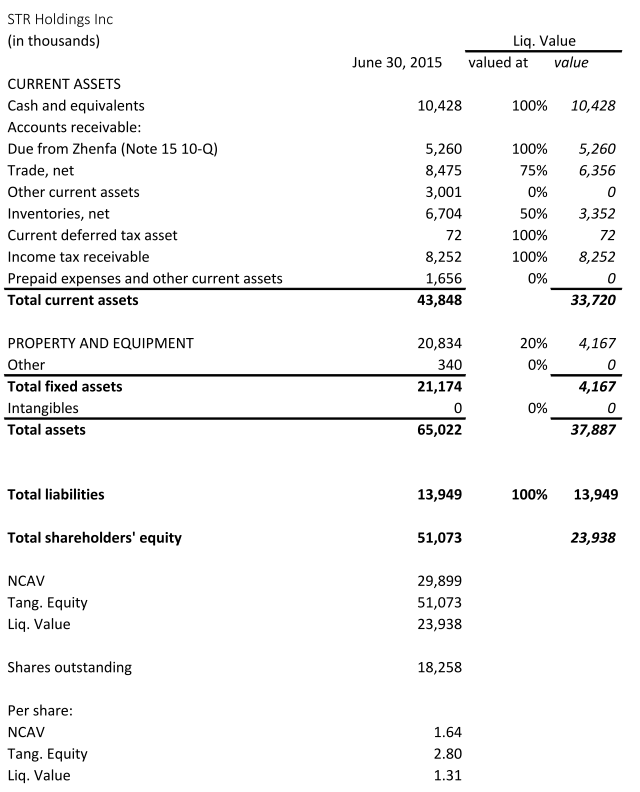
  • Balance sheet consists primarily of liquid assets
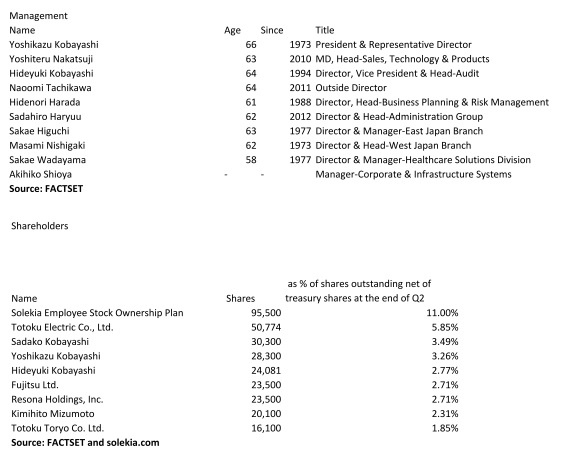
  • Insiders own majority of shares
  • Off the beaten path: Mkt cap = $11.6 million
  • P/NCAV = 0.24
  • P/TB = 0.17
  • P/NNWC = 0.38

On Jan. 22, 2016 QCCO announced plans to delist its stock from the NASDAQ and only provide financial information to stockholders upon request. The following trading day the stock fell off a cliff. QCCO closed at $0.6676 (down 44.38%) while reaching a low of $0.54. I believe the slump is due to indiscriminate selling. While one can make the argument that the stock should trade at a lower valuation because of less liquidity and increased risk. The company will also save money due to lower administrative and legal expenses. At least the drop seems too severe.

QC Holdings, Inc. Announces Voluntary NASDAQ Delisting and SEC Deregistration


OVERLAND PARK, Kan., Jan. 22, 2016 (GLOBE NEWSWIRE) — QC Holdings, Inc. (NASDAQ:QCCO) announced today that it has notified the NASDAQ Stock Market (“NASDAQ”) of its intention to voluntarily delist its common stock from the NASDAQ Capital Market.  The Company intends to cease trading on NASDAQ at the close of business on February 11, 2016.  The Company’s obligation to file current and periodic reports with the Securities and Exchange Commission (“SEC”) will be terminated the same day upon the filing of the requisite notification with the SEC.  The Company is eligible to deregister its common stock because it has fewer than 300 stockholders of record. 


Following delisting and deregistering, the Company presently intends to provide annual information regarding its performance upon stockholder request.  The Company’s shares may be quoted in the “Pink Sheets” (www.pinksheets.com), an electronic quotation service for over-the-counter securities. However, there can be no assurance that any market maker or broker will continue to make a market in the Company’s shares.


The Company’s board of directors determined, after careful consideration, that voluntarily delisting and deregistering is in the overall best interests of the Company and its stockholders. Factors that the board of directors considered include the cost savings that will occur as a result of the elimination of the Company’s obligation to file reports with the SEC, the avoidance of additional accounting, audit, legal and other costs and management’s attention devoted to compliance with the requirements of the Sarbanes-Oxley Act of 2002, the historically low daily trading volume in the Company’s shares, and the benefit of allowing management to focus on the long-term development of our core business.”[1]

QC Holdings provides financial services for underbanked customers in 22 States within the USA and in Canada. QCCO advances primarily single-pay loans (payday loans) (~2/3 of revenue) and installment loans through retail branches and their internet lending operations. Payday loans are small short-term loans. The average term of a payday loan is 18 days.[2] The average amount (principal +fee) is $383. Fees represent $59 of that amount so the average fee per $100 advanced is $18 for 18 days![3] This equates to an extremely high annualized interest rate. Many states effectively have banned or have tried to ban payday loans by imposing limits on the annual percentage rate (APR) that can be charged. There were, for example, efforts in Missouri, which accounts for 32% of the gross profit, to place a voter initiative on the statewide ballot for each of the November 2012 and 2014 elections. The voter initiative was intended to place a limit APR of 36% on any lending in the state. There weren’t enough valid signatures, however, to place the initiative on the ballot of either of the elections. Such a limit would render the provision of payday loans unprofitable.

The amount advanced under installment loans ranges from $400 to $3000.

QCCO offers branch-based installment loans to customers in eight states. Branch-based installment loans are very similar to payday loans in principal amount, fees and interest, but allow the customer to repay the loan in bi-weekly installments. In 2014, branch-based installment loans were offered in 194 locations and accounted for 13.7% of total revenues.

During 2014, the average principal amount of a signature loan was $1,845 and the average term was 20 months. In 2014, signature loans accounted for 10.6% of revenue and were offered in over 200 locations in Arizona, California, Idaho, Missouri, New Mexico and Utah.

Auto equity loans are higher-dollar installment loans secured by the borrower’s auto title with a typical term of 12 to 48 months and a principal balance of up to $15,000. Fees and interest vary based on the size and term of the loan. During 2014, the average principal amount of an auto equity loan was $3,421 and the average term was 32 months. As of December 31, 2014, QCCO offered auto equity loans to customers at 134 branches in Arizona, California, Idaho, New Mexico and Utah.[4] In February 2015, the Company completed the sale of its auto facility for approximately $1.2 million, net of fees to an unrelated third party. The net book value of the property sold was approximately $1.2 million.[5]

qcco 1qcco 2

The balance sheet consists primarily of cash and short-term loans receivable. How much are the loans receivable worth? I think close to book value. To be conservative, however, I cut off 25% for my liquidating value.

qcco 3

“The overall provision for payday loan losses during 2014 was approximately 2.8% of total payday loan volume (including Internet lending). On average, the overall provision for payday loan losses has historically ranged from 2% to 5% of total payday loan volume.”[6]

qcco 4

qcco 5

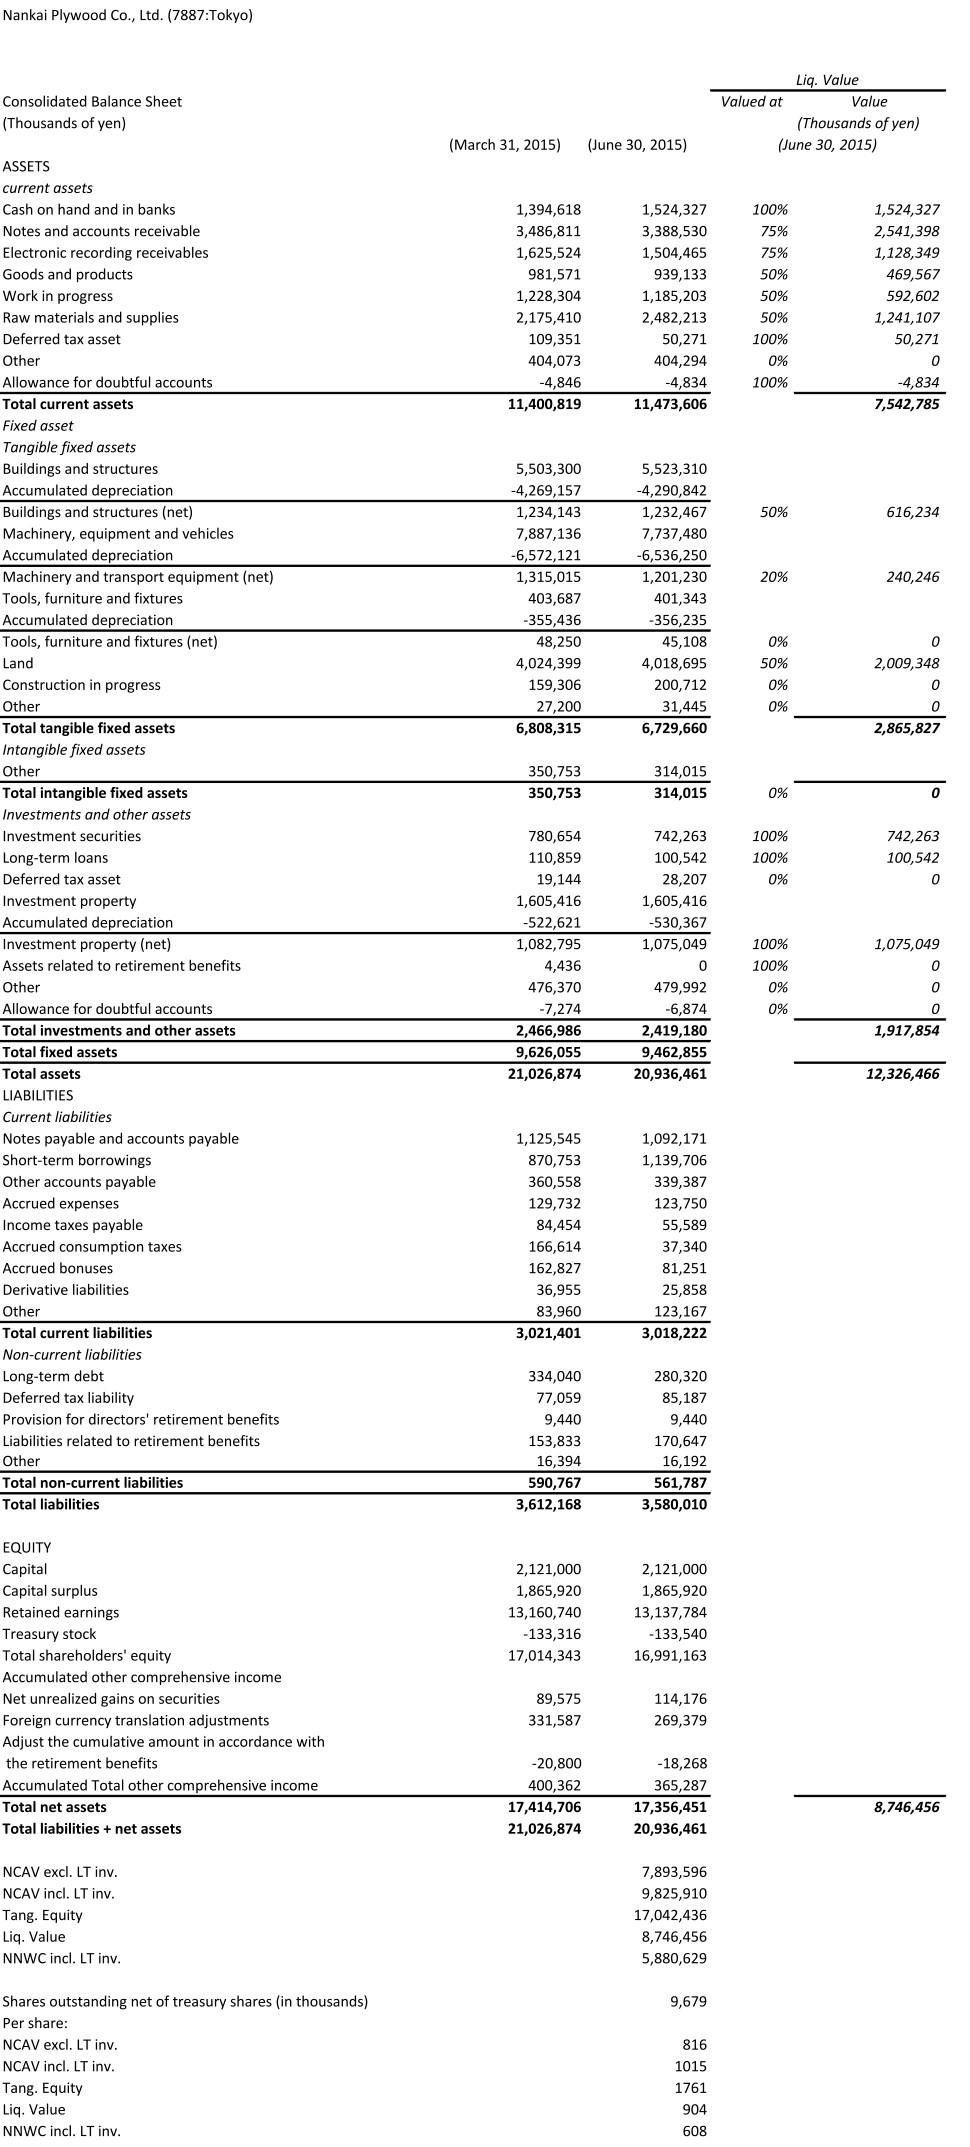
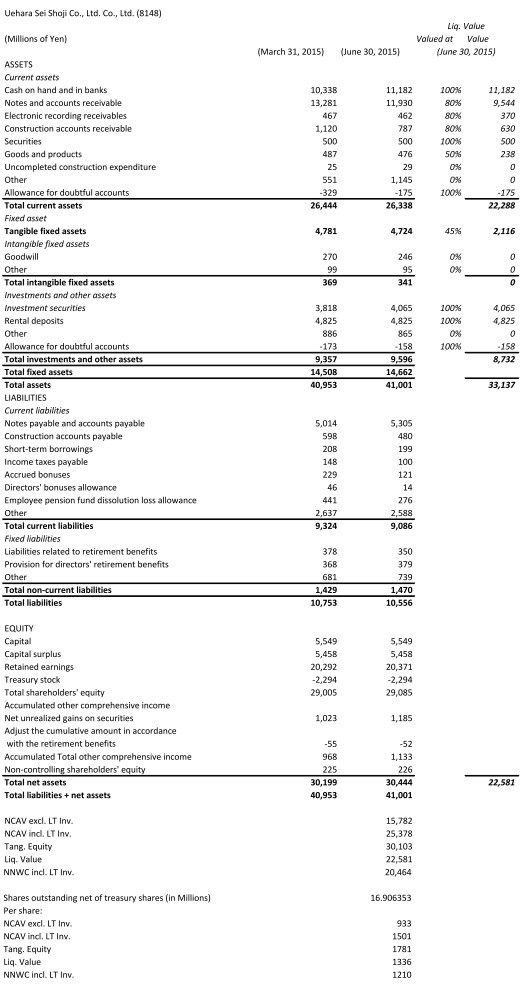
Below are the calculations of net current asset value (NCAV), tangible book value (TB), liquidating value (LV) and net-net working capital (NNWC).

2015_09 ncav

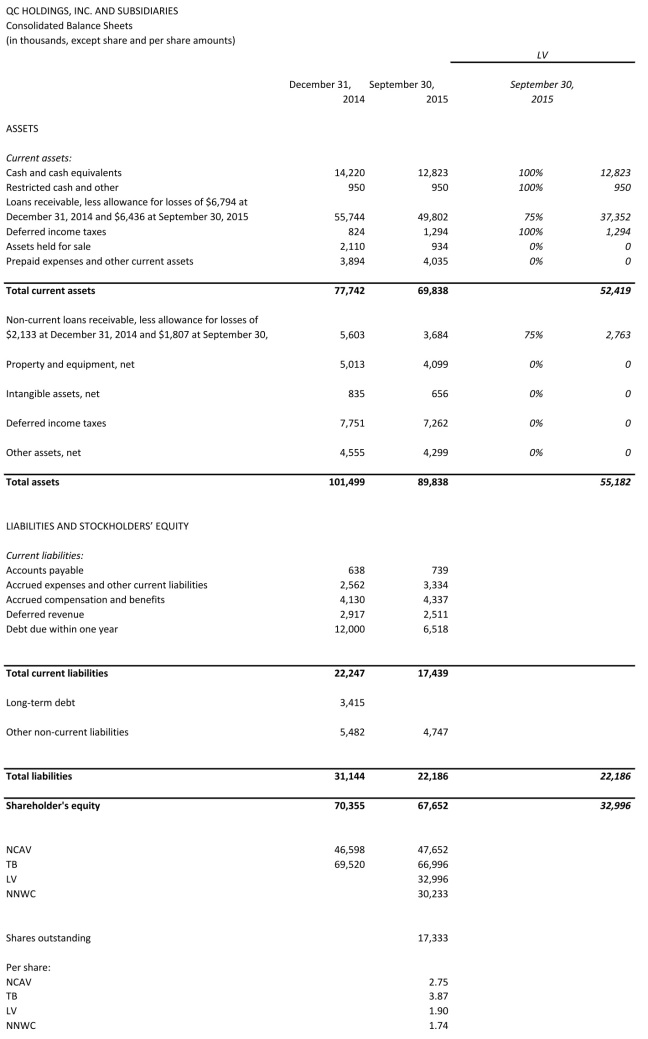
Source: 10-Q 09/2015

There are some things I really don’t like about this company. First, I am very skeptical about the viability of the business. Customers explore alternatives and many states want to effectively ban the services QCCO provides. Yet, management stated their intention to expand the business. Second, the compensation of management is high. There is also a loan from the chairman to the company at a 16% interest rate.

qcco 6

On the other hand, management owns the majority of the stock outstanding. Owning over 8 million shares the chairman should be incentivized to act in the shareholder’s best interest — even after considering the high compensation.

qcco 7

I have no opinion where the stock will trade in the short-term. It can certainly become much cheaper. Dark companies can trade at extreme discounts. I think, however, the stock is a good statistical bet at this price. I like the high liquidity of QCCO’s assets and the alignment of the shareholder’s and chairman’s interest due to his substantial stock holding.

Disclosure: I currently have no position in QCCO but intent to initiate a long position in the next days.

[1] 8-K 01/22/2016 Exhibit No. 99.1

[2] 10-K 2014, p. 7.

[3] 10-Q 09/2015, p. 25.

[4] 10-K 2014, p. 8.

[5] 10-Q 09/2015, p. 8.

[6] 10-K 2014, p. 7.
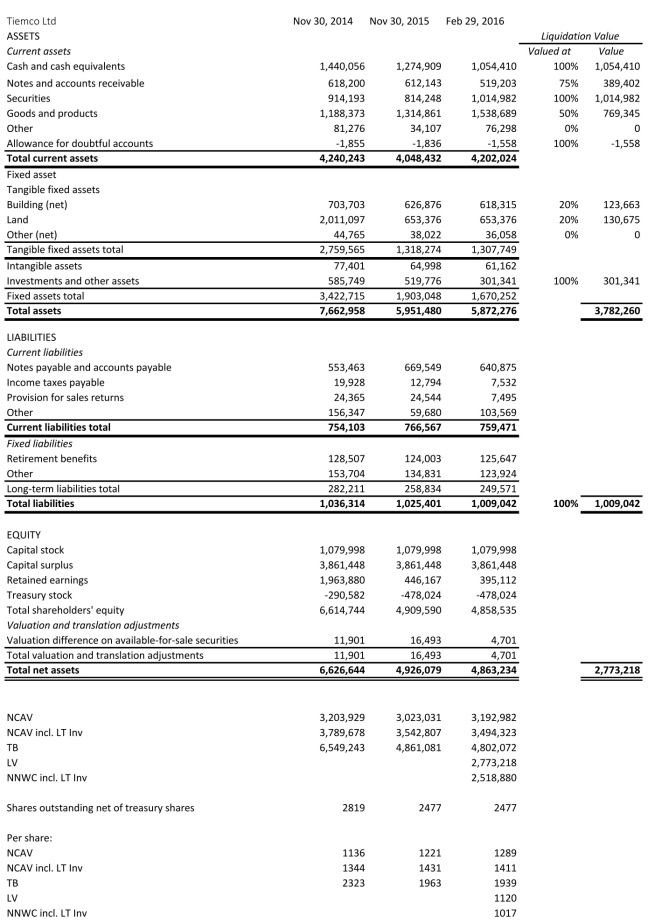
Solekia Ltd (9867:Tokyo)

  • Profitable Japanese net-net
  • 51% discount to NCAV
  • 62 % discount to NCAV + net long-term investment securities and deposits
  • 69% discount to tangible book value
  • Negative enterprise value
  • Management guides to a profitable FY
  • US$12.7 million market cap
  • Reporting in Japanese, only
  • Holding ~15% of own shares in treasury

Solekia Ltd. engages in the IT-related business. It operates through the following segments: Tokyo Metropolitan Area, Eastern Japan, Western Japan, and Others. Solekia sells electronic devices, electronic wires and cables, wire related products, data processing system and software, and telecommunication equipment. The Company also designs, develops, and provides consultation for semiconductors, information and communication systems, and multimedia systems. The company was founded in 1958 and is headquartered in Tokyo, Japan.

The company is currently profitable and management expects the second half and the full FY ending March 31, 2016 to be profitable, as well:

Guidance for fiscal year ending March 31, 2016:

Sales: ¥21.300 million

Operating income: ¥170 million

Ordinary income: ¥195 million

Net income: ¥70 million

Net income per share: ¥80.58


Solekia is tiny. Its market cap is ¥1,526 million (= $12.691 million). Only reporting in Japanese, the stock is under the radar for a substantial part of the investing community. The company owns roughly 15% of its issued shares. Many databases provide inaccurate information for Solekia. Together this makes the stock truly off-the-beaten-track.

Solekia trades at a 51% discount to NCAV. If one includes net long-term investment securities and deposits, the discount increases to 62%. I found nothing that would qualify as a hard catalyst. I also couldn’t find signs of off-balance-sheet liabilities, contingent liabilities or significant litigation. The thesis is plain mean reversion.

Below is the translated balance sheet using Google Translate, the approximation of liquidation value and the calculations of net current asset value, net-net working capital and tangible book value.

transl. balance sheet + ncav solekia
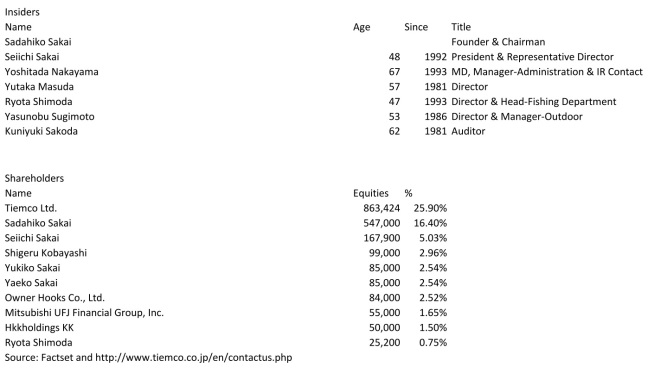
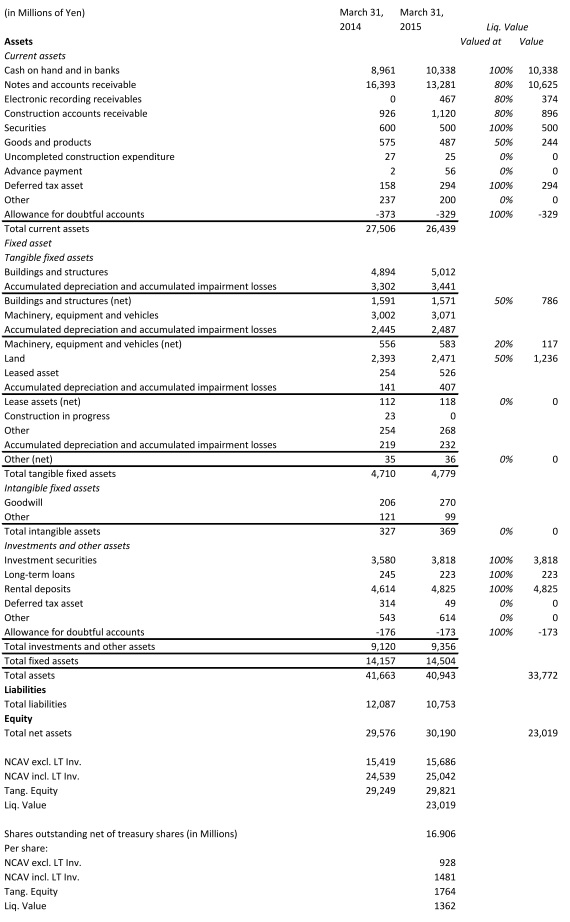
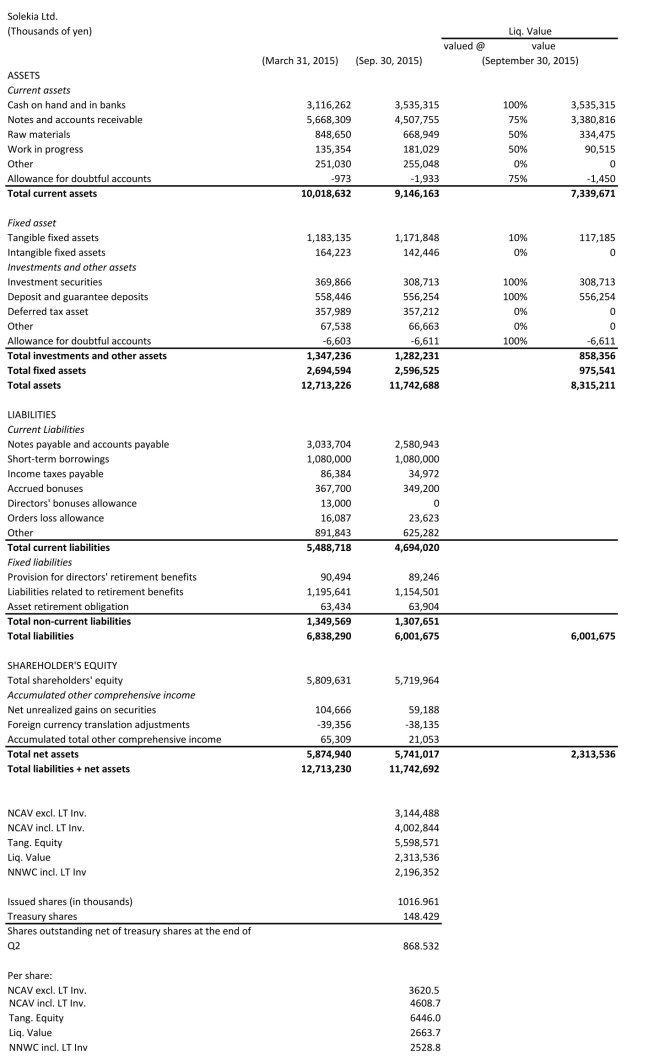
(Source: Quarterly Report for the Second Quarter Ending September 30, 2015 Translated via Google Translate)

The President owns a small amount of shares.

Management and major shareholders

Disclosure: I currently have no position in 9867:Tokyo.

I cannot read Japanese and rely on Google Translate to read the documents. I might miss something important.

Katsuragawa Electric Co Ltd (6416:Tokyo)

  • Small Japanese net-net
  • Market capitalization: ¥2,743 million (US$22.37 million)
  • P / t. B = 0.28
  • P / NCAV = 0.38
  • P / Liq. value = 0.56
  • P / NNWC = 0.61

Katsuragawa Electric manufactures large format printers, copiers and micro motors. This obviously isn’t exactly a growth industry. I expect the printer business, in general, to slowly decline in the future. I think, however, at these prices, the stock is trading significantly below intrinsic value. At ¥179, the stock is trading at a 62% discount to NCAV (including net long-term investments). The company is currently marginally unprofitable. Management guides to a profitable FY 2016 (ending March 2016), however. They expect ¥110 million in ordinary income, from which ¥10 million is attributable to holders of the parent, ¥140 million in operating income and ¥10,500 million in sales for FY 2016. Management identifies the usual suspects to restore profitability: streamlining, reducing fixed costs, better inventory management, cutting executive compensation, firing people and developing new sources of revenue – nothing extraordinary that qualifies as a hard catalyst. On the other hand, I also couldn’t find (which doesn’t mean there aren’t) any signs of major adverse litigation, off-balance-sheet-liabilities etc. that might indicate severely negative surprises in the future. Below is the translated balance sheet, calculation of NCAV, NNWC and a conservative approximation of liquidation value:

ncav + liq. value 09.2015 katsu

(Source: Quarterly Reports for the First and Second Quarter Ending June 30, 2015 and September 30, 2015 Translated via Google Translate)

I want to reemphasize that I can’t read a word in Japanese and might miss something important. This stock represents only a small position in my diversified net-net basket. Decisions in this basket are based almost entirely on quantitative variables.

Disclosure: The author is long 6416:Tokyo.

STR Holdings Inc (STRI:OTC)

  • Delisting resulted in indiscriminate selling
  • >400% upside to private market value
  • >250% upside to NCAV (which is likely to increase due to liquidation of Malaysian facility)
  • Limited downside due to 72% discount to NCAV and no debt
  • History of shareholder friendly actions
  • Reasonable probability of returning to profitability due to synergies with new controlling shareholder and cost cutting initiatives

STRI was delisted from the NYSE on September 29, 2015 “[…] due to its failure to maintain an average global market capitalization over a consecutive 30 trading-day period of at least $15 million.” Since 09/30/15 it trades OTC. I think the stock price crashed on this day due to indiscriminate selling. On 09/29/15 STRI closed at $0.79. The price subsequently reached a low of $0.37 on 09/30/15, a more than 50% decline in one day without any other news and no change in reporting obligations with the SEC.[1] The price has recovered since then to $0.46 on 10/03/15 but the stock is still one of the cheapest net-nets around. At a discount of 72% to NCAV and an above net-net-average quality of the business, STRI is one of the most attractive opportunities at the time.

STRI supplies Ethylene Vinyl Acetate encapsulants to the photovoltaic module industry. I’m not an expert in the solar industry and will not attempt to judge the longer-term viability of STRI’s products and its market position. It appears, however, that STRI is a leading supplier as the company caters to well-known solar companies. I think solar power will be the number one source of energy long-term. However, I will not give this information any weight in valuing this company. This is the same problem an investor faced at the inception of the auto industry, airline industry or the internet. It is one thing to forecast the impact of an industry on society. It is a whole different story to pick the winners and/or project the distribution of earnings and losses.

On 12/15/14 STRI announced that Zhenfa Energy Group purchased 27.6 million newly issued shares of common stock (before the reverse-split), representing a 51% interest in STRI for $21.7 million. [2] STRI’s CEO states:  “As one of the top solar engineering, procurement and construction companies in China, and a leading solar independent power producer as well, Zhenfa is ideally positioned to directly benefit from the use of STR’s market-leading encapsulant technology and also to advocate its use to Chinese module manufacturers. Zhenfa’s substantial investment reflects their confidence in STR’s ability to become profitable and grow in the rapidly expanding solar industry.”[3] This transaction price can be seen as an indication of intrinsic value as defined by the price a strategic buyer would pay for the business. On 01/02/15 STRI paid out a special dividend of $2.55 per share other than Zhenfa’s shares. On 02/02/15 STRI carried out a 1:3 reverse split. By buying 51% of the company (without the right to receive the special dividend) for $21.7 million, Zhenfa effectively valued the whole business in excess of $42.5 million 10 month ago.  At today’s share count of ~18 million, this represents a private market value of ~$2.36/share. Since the closing of the transaction, STRI incurred further losses. These were probably expected by Zhenfa and thus don’t impair the $2.36/share purchase price, which seems reasonable in comparison to the tangible book value of $2.8/share. At the closing price on Friday of $0.46, this translates into an upside of over 400%. Further, STRI plans to close its Malaysian facility in response to its largest customer ceasing operations in Malaysia. Management expects $8 million proceeds from the sale of real estate and $1 million to $1.5 million one-time costs mainly due to severance payments partially offset by proceeds from the sale of equipment. If the liquidation turns out as expected, this would increase my estimate of liquidation value (and NCAV) substantially. In addition, the closure of this facility is expected to improve the utilization of STRI’s other facilities and thus will probably benefit profitability.

2015_06 ncav + liq. value

(Source: 10-Q for the Second Quarter Ending June 30, 2015)

Despite the recent unprofitability, I think STRI has been acting very shareholder friendly. The company has a history of distributing special dividends, buying back stock and shrinking for the sake of shareholder value maximization. As the new controlling shareholder, Zhenfa is incentivized to maximize shareholder value by returning the company back to profitability. Despite the generally poor evidence of synergy manifestation, I think, in this case, the alliance really could be mutually advantageous. For this investment to be profitable for the minority shareholder, however, one doesn’t need the benefits of synergy. Just a return of the stock price to the current NCAV would render this investment very profitable. Since the transaction, one director bought ~$90k worth of stock between $1.11 and $1.13.[4] Lloyd Miller III also has a position in STRI. His name appears frequently in the ownership tables of net-nets and in case of shareholder abuse, he assumes the role of an activist investor.

In summary STRI is an unusually attractive net-net. The company is a leader in its niche. The price is probably depressed due to price insensitive selling in response to the recent delisting. The downside is protected by current assets, especially the large net cash balance (no debt), which is likely to increase substantially due to the liquidation of the Malaysian facility. Historically, the company has been shareholder friendly by distributing excess cash to shareholders in the form of special dividends and share buy-backs. There is a reasonable probability of the company to return to profitability due to synergies and cost cutting. The private market value is around $2.36/share (>400% upside). NCAV is around $1.64/share and will probably increase due to the aforementioned liquidation. This situation combines a very large upside potential and limited downside AND an above average probability of a favorable outcome.

Disclosure: The author is long STRI.

Disclaimer: This article is for informational purposes only and does not constitute investment advice.

[1] See: Form 8-K (September 29, 2015), p. 2.

[2] See: Announcement by the Company (December 15, 2014)

[3] See: Announcement by the Company (December 15, 2014)

[4] See: Form 4 (May 18, 2015)

Art Vivant Co Ltd (7523:Tokyo)

Profitable net-net, inaccurate database numbers, small market cap

Art Vivant operates in art related businesses. The business model is however quite diffuse. According to the Japan Company Handbook, the company is a top ranked seller of modern lithography art and other artworks. The company targets customers in the range between 20 and 30 years old. The company is also engaged in the operation of fitness clubs, yoga studios, an app called “Wonder4World” and a hotel under the name “Tarasa Shima Hotel and Resort”. Art Vivant also provides financial services with artworks as collateral.

Management guides to a net profit of ¥510 million or ¥39 per share for FY 2016. Note that this information might be hard to find for foreign investors. This information, like the information regarding the shares outstanding, is on the first page of the quarterly report. For some reason, this page is formatted as a picture. Hence, an electronic translator like Google Translate will not translate this information. There is no way of knowing, by looking at the translated document, that this information is even there. The company reports in Japanese, only.

The company owns 2.387 Million treasury shares. This represents 15.44% of the 15.464 Million total issued shares. Thus, there are 13.077 million shares outstanding net of treasury shares. As I pointed out in the Uehara Sei Shoji Co write-up, many databases calculate an inaccurate market capitalization for Japanese companies as they don’t subtract treasury shares from issued shares. This is also the case for Art Vivant. Hence, superficial screens overestimate the market cap and, as a result, the valuation for Art Vivant. Based on the current market price of ¥344, the correct market cap is ¥4.499 billion (= $37.57 million). With such a small size, institutional investors are effectively excluded from investing in this company. The lack of institutional investors paired with inaccurate database numbers and hard to get financial information might result in the deep neglect of the stock.

Art Vivant trades at a 61% discount to its NCAV. If one includes investment securities and deposits in NCAV, the stock trades at a 63% discount. While the investment securities and deposits are technically non-current assets, it makes sense to include them in NCAV, I think, because of their liquidity.

Below is the translated balance sheet (using Google Translate), the calculations of NCAV and an approximate liquidation value:transl balance sheet + liq value art vivant june 2015 jpeg

(Source: Quarterly report for the first quarter of FY 2016)

Disclaimer: This stock represents only a small percentage of my net-net basket. Stocks in this basket are picked based on quantitative variables. Almost no qualitative analysis is performed for these statistical picks.

Disclosure: The author is long 7523:Tokyo.

Nankai Plywood Co Ltd (7887:Tokyo)

Japanese net-net

Nankai Plywood Co. is another Japanese net-net. Earnings over the last 10 years have been volatile but, on average, positive. Management guides to a net profit of ¥15.50 per share for the FY 2016. According to the Japanese Company Handbook, the company is a top ranked manufacturer of Japanese-style room ceilings and floors, holding the highest market share in laminated ceilings. At its current market price of ¥412 per shares, it’s trading at a market cap of ¥3.988 billion (= US$32.034 million). With such a small market cap, institutional investors are effectively excluded from participating. It trades at a 49% discount to its NCAV of ¥7.894 billion. If one includes long-term investments in NCAV – which is sensible, I think, if one views NCAV as a proxy for liquidation value – it trades at a 59% discount. The company also owns a substantial amount of tangible fixed assets. Especially land, which I conservatively valued at 50% of book value in the liquidation analysis, could be worth more. The P/Tang.B is very low at 0.23.

Below is the translated balance sheet (using Google Translate) and a liquidation value analysis:

ncav + liq. value publish

(Source: Quarterly report for the first quarter of FY 2016)

Disclosure: The author is long 7887:Tokyo.

Uehara Sei Shoji Co Ltd (8148:Tokyo) Update

Short update for Q1 2016, ending June 30, 2015

Uehara Sei Shoji Co disclosed results for the first quarter of FY 2016 today. The company made a net profit per share of ¥9.02. The “liquidation value” has hardly changed at all:

balance sheet ^M cons. liq. value 30 JUNE 2015 better definition

(Source: Quarterly report for the first quarter of FY 2016)

The company didn’t disclose the individual tangible assets accounts. I therefore used the weighted average multiplier for tangible assets from the liquidation analysis for the last quarter. The difference in this account is negligible. I included one additional variable:

NNWC incl. LT Inv. : = Cash + 0.8 Accounts receivable + ST Securities + 0.5 Inventory – Allowance for doubtful accounts + Investment securities + Deposits – Total liabilities.

I encountered some investors, who found it inappropriate to deduct treasury shares from what the company reports as “shares outstanding”. They argued that as long as treasury stock isn’t retired, the share count does not decline. While it is technically true that the share count does not decline if the shares are not retired, holding treasury stock is economically equivalent to retiring bought back stock. In calculating EPS, the company does rightfully deduct treasury stock from “outstanding shares”. Some of the confusion might stem from the fact that outstanding shares is generally defined as issued shares minus treasury shares. Japanese corporations, however, report outstanding shares inclusive of treasury shares. It might be a translation mistake. However, the likelihood for that is very low as I tried many languages and in all cases it is translated as “outstanding shares”. This, in general, presents an opportunity as many databases naïvely calculate the market capitalization using “outstanding shares”. As many Japanese corporations own treasury shares, the market capitalization, and therefore the valuation, is overstated for many Japanese stocks.

Disclosure: The author is long 8148:Tokyo.

Uehara Sei Shoji Co Ltd (8148:Tokyo)

Profitable Japanese net-net, share buyback, increasing net current asset value per share, inaccurate database numbers, small, off the beaten path

Uehara Sei Shoji is a Japanese net-net. At the current market price of ¥519 per share, it trades at a 65% discount to its net current asset value of ¥1,481/share (including long-term investments, which consist mostly of investment securities and rental deposits). Tangible equity per share is ¥1,764. This equates to a P/Tang. B of 0.29. Management has consistently been buying back stock. As of March 31, 2015, Uehara owns 7,147K of the total of 24,053K issued shares. Hence, there are 16,906K shares outstanding net of treasury stock. So Uehara owns roughly 30% of its own shares! This might be a contributing reason for its very cheap valuation, as many databases provide an inaccurate market capitalization number. As a consequence, a superficial screen would overestimate the valuation. With an actual market cap. of ¥8.774 billion (= US$71 million) Uehara is too small for larger investors. Financial reports are only available in Japanese, which should render the stock “uninvestable” for many individual investors outside Japan. Graham/Dodd investing appears to be not prominent among Japanese individual investors. Together, this might contribute to a deep neglect of the stock. The downside is sufficiently protected by a cash balance of ¥9,936 (cash ¥10,338 – debt and capital leases ¥402) and a history of profitability. Buying back shares at these low prices is hugely value accretive.

“Uehara Sei Shoji Co., Ltd. operates as a trading company in Japan. It sells construction materials, and products for energy, housing, and other facilities. The company’s products include cement, ready-mixed concrete, sash, glass, pile, lightweight external wall material, housing equipment, other building materials, gasoline, light and heavy oil, lubricant, propane gas, butane gas, and compressed natural gas, as well as car maintenance products. Uehara Sei Shoji Co., Ltd. was founded in 1943 and is headquartered in Kyoto, Japan.” (Source: Bloomberg)

The Company has been consistently profitable over the last 10 years. In FY2015 Uehara made a net profit of ¥547 Million. Management guides to a net profit of ¥550 million in FY2016. This means the company generates only a 1.8% return on tangible equity. This is due to large cash holdings and holdings of securities, which is quite typical for Japanese corporations. The enterprise value is negative. (Or positive but very small if factors in that some cash is needed for the operations). Earnings, however, are secondary to the thesis. This is an asset play. The “liquidation value” is considerably higher than the price. I don’t expect the company to liquidate any time soon. However, a company that isn’t burning through its cash should not trade at such a low valuation. Below is the translated balance sheet from the annual report of FY 2015 (using Google Translate) and a calculation of the approximate liquidation value:balance sheet + cons. liq. value march 2015

(Source: Annual Report 2015)

As mentioned before the company has bought back very large amounts of shares. And, most importantly, they have been bought at great prices. I tabulated the share count (in thousands) over the last 11 years below:share count

(Source: Annual Report 2006 – 2015)

Taking cash out of the bank account and buying your own cash at a discount plus all other net assets for free is a no-brainer. By taking this action, Management has been acting very shareholder friendly. The Uehara Family is the largest holder with 1,640K shares (Source: FactSet), which represent 9.7% of the outstanding shares net of treasury stock. Thus, management’s interest should be aligned with minority shareholders’.

This is not a high conviction idea. I cannot read a word in Japanese. All information has been gathered from filings by the company using Google Translate. I might be missing something important. The stock only represents a small position in my diversified net-net portfolio. However, with the large buyback, the company acts vastly more shareholder friendly than many other Japanese net-nets. If this behavior continues, it should also serve as a catalyst for closing the valuation gap. The downside is very limited and the upside should be between “liquidation value” of roughly ¥1360/share and tangible equity of ¥1760/share.

Disclosure: The author is long 8148:Tokyo.